
Bitcoin is trying to extend its rebound towards $84,000, but buyers are still struggling to set their pace. On October 11, 2026, its price moved around $83,770, after hitting a recent low point at $80,308. This rise improves technical conditions, without confirming a lasting return of the rise. Between persistent resistance, contrasting moving averages and hesitant indicators, the market is still looking for a clear signal.

In brief
- Bitcoin is trading around $83,770 after rebounding from $80,308.
- The resistance located between $83,900 and $84,200 is still slowing the price’s progression.
- A break above $84,200 could open the way towards $84,800 and then $85,500.
- Oscillators remain mixed and do not yet confirm a solid return of bullish momentum.
- A fall below $82,500 would expose the market to a further decline towards $81,500, then $80,308.
Bitcoin still stumbles over resistance at $84,000
The price of bitcoin stands at $83,771.70, an increase of 0.9% over the last 24 hours. Its capitalization reached 1,683 billion dollars, which reflects a recovery after the last difficult sessions. However, this improvement is not yet enough to confirm lasting acceleration. Buyers must now cross several technical levels to strengthen their position.
According to theBitcoin News analysison the hourly chart, the price is moving in a range between $83,700 and $83,800. This consolidation comes after a rise from $80,308, followed by a return above $83,000. Trading activity had accompanied the initial movement, but the price is now struggling to continue its progression. This development shows that buyers face more difficulty as the price approaches a significant resistance zone.
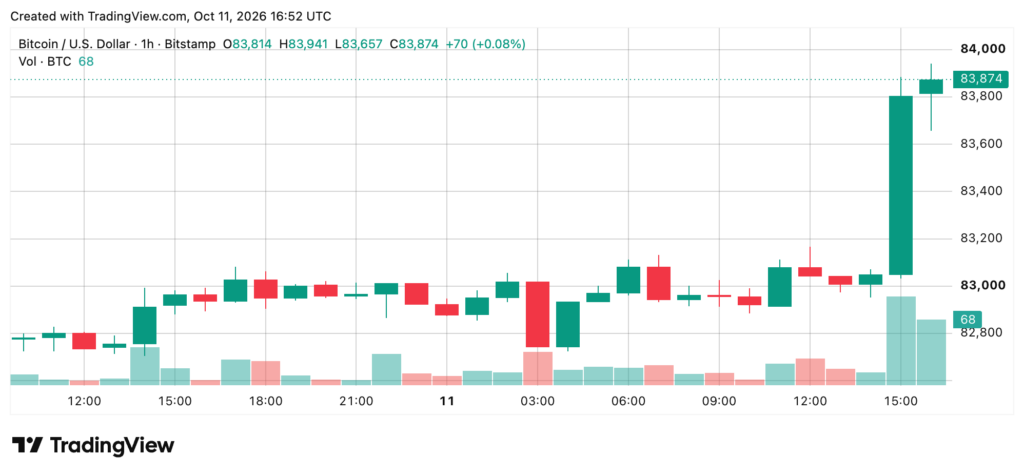
The area between $83,900 and $84,200 thus constitutes the first major obstacle. As long as the market remains below this range, upward attempts may lack strength. A clear break above $84,000 could open the way towards $84,800. Conversely, a new rejection would expose the price to a return towards $83,300, then towards $83,000.
Four-hour chart shows gradual improvement
The four-hour analysis presents a more favorable pattern than that of the hourly chart. Since the pullback that took it below its recent high of $86,677, the market has gradually reduced selling pressure. The formation of higher and higher highs attests to this short-term improvement. However, this development is not yet enough to establish a confirmed bullish reversal.
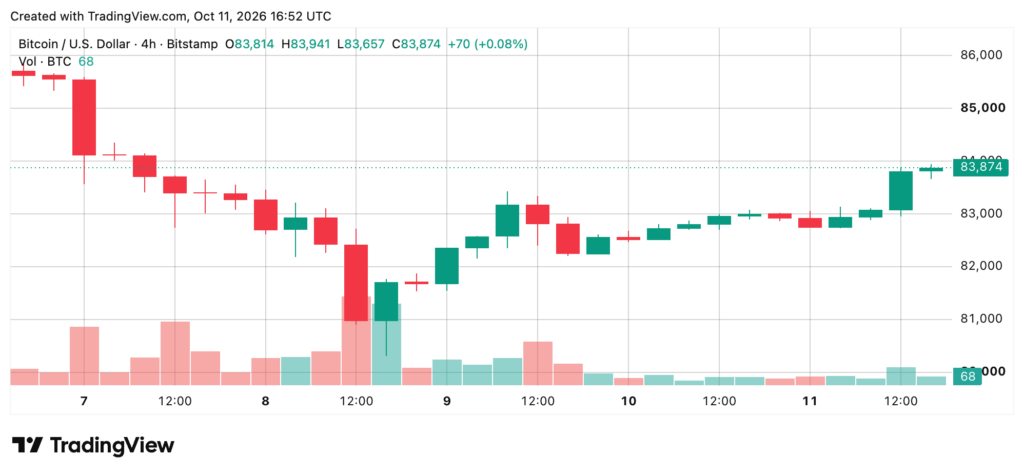
Maintaining the price above $83,000 remains important to preserve this structure. Specifically, the area between $83,000 and $83,300 provides immediate support for the recovery. If buyers defend this level, the market could continue its consolidation before another attempt towards $84,000. This configuration therefore leaves room for progress, without guaranteeing rapid acceleration.
On the other hand, a break below $82,500 would significantly weaken the recovery scenario. The price could then head towards $81,500, where buyers should try to limit losses. This decline would call into question the improvement observed on the four-hour chart. For the moment, the data mainly indicates an easing of downward pressure, rather than a confirmed change in trend.
Daily chart maintains medium-term caution
We still stay with the analysis of Bitcoin News, on a daily scale, the situation remains more contrasted. Bitcoin is still trading below its recent high of $87,374, despite its rebound from the $81,000 zone. The succession of decreasing peaks has not yet experienced a decisive break. This configuration therefore maintains a risk of further decline if sellers continue to defend resistance.
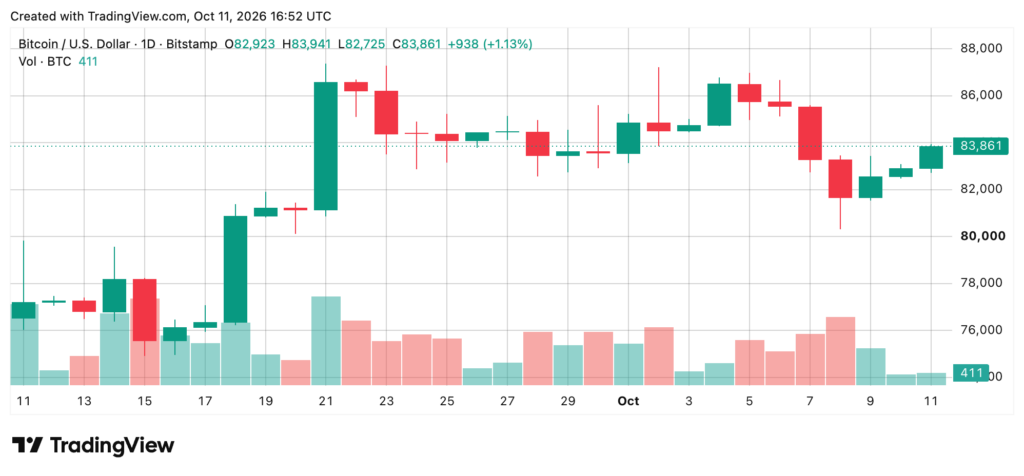
However, several long-term moving averages remain below the current price. This positioning indicates that the underlying technical structure retains supporting elements. The market has therefore not erased all the positive signs despite its recent decline. However, this underlying resistance does not guarantee that buyers will succeed in regaining control in the short term.
Support levels provide a better measure of risk. The first is around $82,735, followed by the $82,500 area. A break of these thresholds could increase sales and bring the price back towards $80,900. The recent low of $80,308 would then remain an important benchmark for assessing the strength of the recovery. As long as the market remains below $87,374, the daily trend has not confirmed a lasting reversal.
Oscillators signal still insufficient momentum
Oscillators provide additional information on the strength of the current movement. On the daily chart, therelative strength index (RSI) reached 52, while the stochastic stood at 37. These two values reflect a relatively neutral situation, without a particularly marked bullish signal. The price is rising, but the indicators do not yet show a clear acceleration in purchases.
Other measurements confirm this hesitation. The Commodity Channel Index (CCI) stands at -94, while the Average Directional Index (ADX) reaches 33. The latter figure indicates a relatively strong trend, but does not specify whether it is moving up or down. The market therefore presents a certain directional force, without the indicators clearly designating buyers as the main beneficiaries.
The Awesome oscillator reads 944, while the Momentum indicator reaches -1,832 and the MACD stands at 863. The classifications provided, however, consider both Momentum and MACD negative. The Fast Stochastic RSI sits at 20, the Williams Indicator at -61, and the Ultimate Oscillator at 42. Finally, the Bull Bear Power hits -1,158, underscoring the buyers’ continued struggles. Overall, these data do not yet confirm a recovery strong enough to rule out the risks of rejection.
Moving averages oppose support and resistance
Moving averages reveal a market split between favorable short-term signals and near price obstacles. The price is trading above the 10-period exponential moving average (EMA), located at $83,503. It is also above the 20-period EMA, set at $83,193. These two indicators offer potential support for the current move.
However, simple moving averages show a different picture. The 10-period simple average stands at $84,052, while the 20-period simple average stands at $84,199. The price remains below these two levels, which reinforce the resistance zone already observed on the hourly chart. This opposition between exponential and simple averages illustrates the market’s difficulties in transforming its rebound into a confirmed upward trend.
Longer term averages provide additional benchmarks. The 30-period EMA sits at $82,253 and the corresponding simple average stands at $82,472. The 50-period EMA stands at $79,993, while the 50-period simple average stands at $80,928. The 100 and 200 period averages also remain below the current price, supporting the underlying structure. However, the volume-weighted moving average at $84,164 represents another immediate hurdle.
The next thresholds will determine the continuation of Bitcoin’s rebound
The bullish scenario first depends on the price maintaining above $83,000. This zone would preserve the recovery structure seen on the four-hour chart. A sustainable progression above $84,200 would then strengthen the prospects of an extension towards $84,800, then $85,500. If buyers also break through these levels, the previous high of $86,677 would once again become a technical target to watch.
Conversely, a new failure below the resistance between $83,900 and $84,200 could restart profit-taking. A fall below $83,000 would weaken the immediate recovery and expose the price to $82,500. If this support gives way, the levels of 81,500 and 80,308 dollars could come into play. The persistence of negative signals on the Momentum and the MACD reinforces the need to monitor these thresholds.
Future movements will therefore depend on the market’s ability to confirm the increase through converging technical signals. Crossing resistance must be accompanied by an improvement in oscillators to make the recovery more convincing. Conversely, a loss of successive supports would signal a weakening of the current structure. Investors thus have several precise levels to follow the evolution of the balance of power between buyers and sellers.
In conclusion, BTC retains signs of stabilization, but its rebound towards $84,000 still lacks momentum. A confirmed break above $84,200 would open the way towards $84,800 and $85,500, while a return below $82,500 would increase the risk of a further correction. The next sessions will determine whether buyers manage to transform this technical recovery into a lasting movement or whether the current resistance prolongs the hesitation phase.
Maximize your Tremplin.io experience with our ‘Read to Earn’ program! For every article you read, earn points and access exclusive rewards. Sign up now and start earning benefits.