Solana is currently crossing a consolidation phase between $ 164 and $ 185, oscillating around $ 174. Paradoxically, this technical break is accompanied by a remarkable vitality of its DEFI ecosystem. Will this dynamic suffice to propel soil beyond its current consolidation zone?

In short
- The total locked value (TVL) in the Solana DEFI has been leaping by 28 % since April, reaching $ 9.34 billion.
- The open interest in soil term contracts is 7.35 billion dollars, testifying to an appetite for the risk.
- The course consolidates between crucial technical levels of $ 164 and $ 185.
A Solana's DEFI ecosystem that defies the gloom of the course
Solana is currently going through a technical consolidation phase, but the fundamental data tell a completely different story.
Since April 1, 2025, the blockchain has seen its total locked value (TVL) climb from 6.63 to 9.34 billion dollars, according to the data de Defillama. This 28 % increase is a growing confidence of investors in the ecosystem.
This growth is explained by Solana's technological assets: derisory transaction costs and a high treatment flow that seduces developers and users.
Investors massively lock their cryptos in smart contracts, anticipating long -term detention. This strategy mechanically reduces the available offer on exchange platforms.
At the same time, the derivative products market confirms the sustained interest in soil. The open interest in term contracts is 7.35 billion dollars, accompanied by a daily exchange volume of 9.4 billion. These figures reveal an intense activity and bullish bets on the future evolution of the course.
Technical signals that temperate optimism
Despite these encouraging fundamentals, Solana's technical analysis draws a more nuanced landscape. The course is currently evolving in a narrow corridor between $ 164 (crucial support) and $ 185 (tenacious resistance). This consolidation has lasted for weeks, creating a palpable tension on the markets.
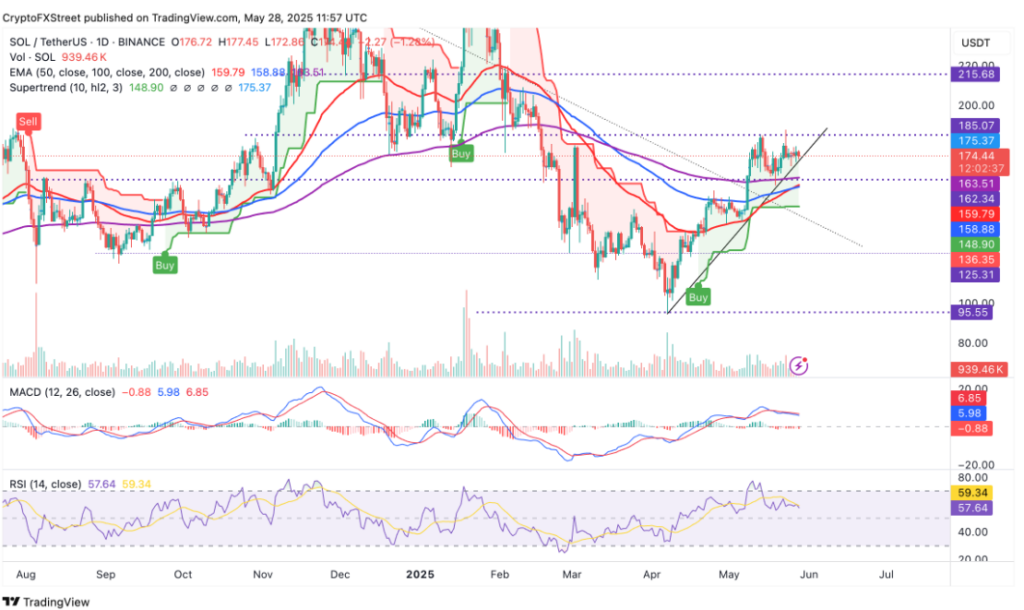
Technical signals sound the alarm. The MacD changed in sales mode on May 18, a sign that the upward dynamics run out of steam. The RSI index slips dangerously around 50 points. A passage under this threshold would probably trigger a correction.
Traders carefully monitor the reaction of the course to the ascending trend line, the rupture of which would probably trigger selling pressures.
In the event of a lower break, the supports to be monitored are at $ 159 (confluence of the mobile averages 50 and 100 days) then $ 140 (request zone tested in early May). Conversely, a crossing of $ 185 would reopen the road to $ 200, level tested as resistance in April.
In short, Solana lives a decisive moment. On the one hand, its Defi ecosystem thrives and always attracts more investors. On the other, the graphs call for vigilance. Does this technical break hide a preparation for flight or does it announce a correction? The next few weeks will provide the answer.
Maximize your Cointribne experience with our 'Read to Earn' program! For each article you read, earn points and access exclusive rewards. Sign up now and start accumulating advantages.