

The recent movement in the price of bitcoin reminds some observers of one of the most spectacular commodity bubbles in modern history. Veteran trader Peter Brandt believes that the bitcoin chart now resembles that of the soybean market in the 1970s, marked by a cycle of sharp rise followed by a sharp collapse.
In brief
- Peter Brandt says the bitcoin chart forms a rare widening top, often a harbinger of a market high.
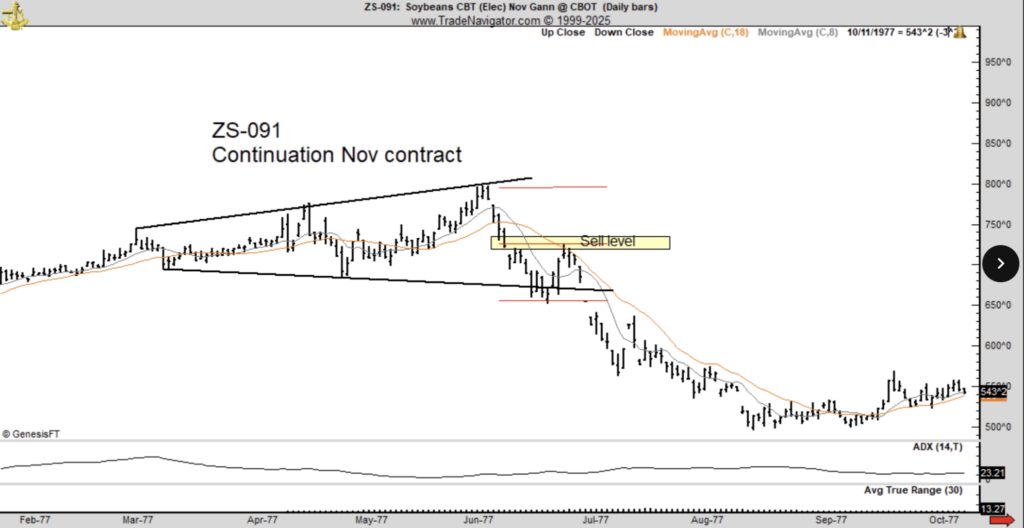
- He compares this pattern to that of soybeans in the 1970s, whose prices fell by 50% after a similar pattern.
- Despite this warning, some analysts like Arthur Hayes believe that bitcoin could still rise to $250,000 before the end of the cycle.
- BTC remains up 62% year-over-year and above its 200-day moving average, but fears of a reversal are intensifying in the face of new tariffs and the general market downturn.
Brandt sees signs of exhaustion and correction
The 1970s were synonymous with extreme volatility on world markets: prices of raw materials, including soybeans, soared before collapsing when supply exceeded demand. Brandt today warns of similar signs of bitcoin running out of steam, which could herald a sharp fall.
The veteran explains that the bitcoin chart appears to be forming an expanded top, a pattern historically associated with major market reversals. It evokes striking parallels with the 1970s soywhose prices had lost around 50% after the appearance of the same pattern.
Bitcoin forms a rare broadening top on the charts. This pattern is known for announcing highs. In the 1970s, soybeans reached this same peak before losing 50% of their value.
Peter Brandt
According to him, if the scenario repeats itself, bitcoin could correct to around $60,000.
Brandt adds that such a decline would harm not only individual investors, but also large exposed companies, notably MicroStrategy, Michael Saylor's company, whose stock (MSTR) fell 10.13% over the month. The decline reflects the pressure bitcoin-centric companies are facing as the value of their assets declines.
Strong fundamentals despite market fear
Despite Brandt's cautious tone, several analysts believe that bitcoin could further extend its rise. Arthur Hayes, co-founder of BitMEX, for example, predicts a rally towards $250,000 before the end of the current cycle.
This optimism is based in part on historical trends: according to CoinGlass, the fourth quarter is traditionally the most favorable for bitcoin, with an average return of 78.49%. The month of October, in particular, is among the best performing.
The main indicators remain encouraging:
- Current price: around $108,832, after a quiet session.
- Annual performance: +62% over one year.
- Ranking: Bitcoin outperformed 89% of the top 100 cryptocurrencies.
- Technical: it remains above its 200-day moving average.
- Volume: 16 positive days out of the last 30.
However, sentiment has deteriorated since the announcement of Donald Trump's new tariffs, causing markets to decline and fear to rise in the crypto sphere. The Crypto Fear & Greed Index shows a score of 25, signaling increased caution among traders.
Analysts are betting on a rebound
On a rejection during the previous session.
Some analysts remain optimistic about bitcoin's prospects. David Hernandez, crypto investment specialist at 21Shares, believes the upcoming US Consumer Price Index (CPI) report could trigger a rebound if inflation shows signs of slowing. According to him, such a scenario could quickly reopen the upside window for bitcoin.
Michaël van de Poppe, founder of MN Trading Capital, shares this opinion. He said gold's recent 5.5% decline could mark the start of a rotation into bitcoin and altcoins. For their part, Citi analysts believe that MicroStrategy stock could still benefit from an upward movement if bitcoin reaches $181,000 over the next twelve months, fueling hopes of a new major rally.
Maximize your Tremplin.io experience with our 'Read to Earn' program! For every article you read, earn points and access exclusive rewards. Sign up now and start earning benefits.


