

Not much has changed since my last analysis. As you already know, I remain bearish, and have said that until we break $67,000, Bitcoin will likely return to the $60,000 zone. You also know that my analysis is mainly based on technical signals and psychotrading. There’s not much new to analyze here because the structure hasn’t really changed, but let me tell you something: There are still about 50 days of bear market left if the cycle continues as expected. For some time now, BTC has been moving sideways in the $60,000 to $65,000 range.

For what ?
The reason is quite simple: we are in an accumulation phase, which means we are either forming the trough or approaching it. We could still see one last sell-off dive below the range before the market gradually begins to move higher.
On the daily chart, we can see that the area around $62,000 is holding well as support, while the area around $65,000 to $67,000 continues to act as resistance.
Does this mean we are bullish?
No. Not yet.
We are still in a bear market. But if history and the cycle repeats itself, there may be little time left.
We must also remember that we are in the summer period, when markets typically experience less activity and reduced volatility.
But that’s often what accumulation looks like.
During an accumulation phase, we normally do not see consistent and significant upward movements. Once the accumulation ends and the market finally leaves this zone, there is a high probability that we will not see these price levels again for years – or potentially ever.
This is why, for me, the entire area below $65,000 is an area for DCA incrementally.
Many investors will eventually tire of waiting for even lower prices. And when the market starts to move, that patience can quickly turn into FOMO – the fear of missing out because they didn’t buy when prices were still low.
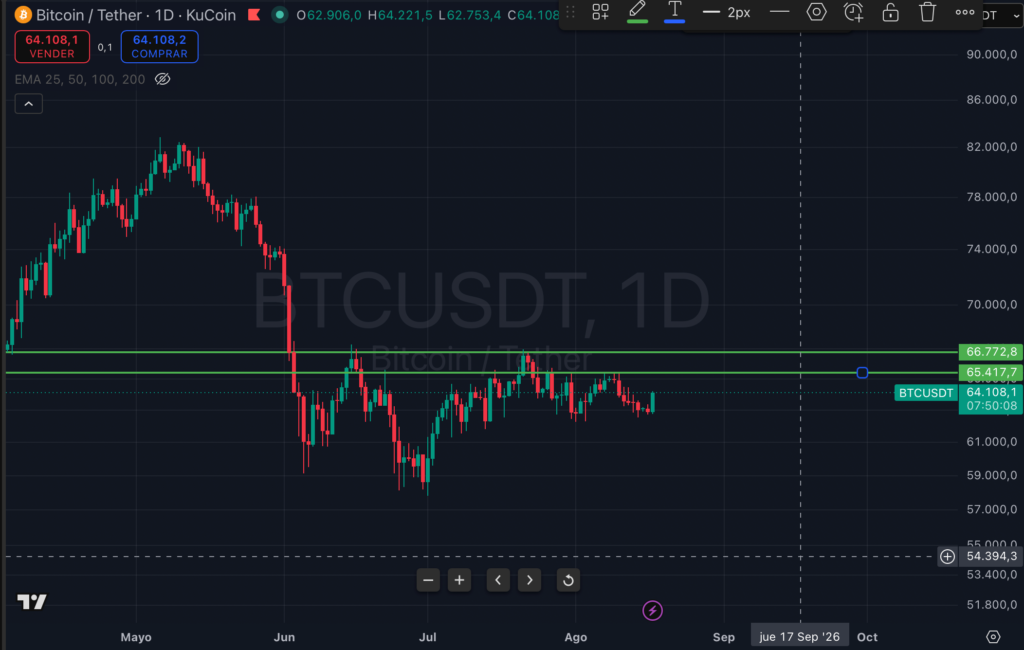
Chart: BTC/USDT, period 1D (KuCoin / TradingView).
Maximize your Tremplin.io experience with our ‘Read to Earn’ program! For every article you read, earn points and access exclusive rewards. Sign up now and start earning benefits.


