After starting a rebound following the recovery of the cryptocurrency market, Solana has finally reached its support for the sixth time in a row. Let’s take a look at the future outlook for the SOL price.
Location of Solana (SOL)
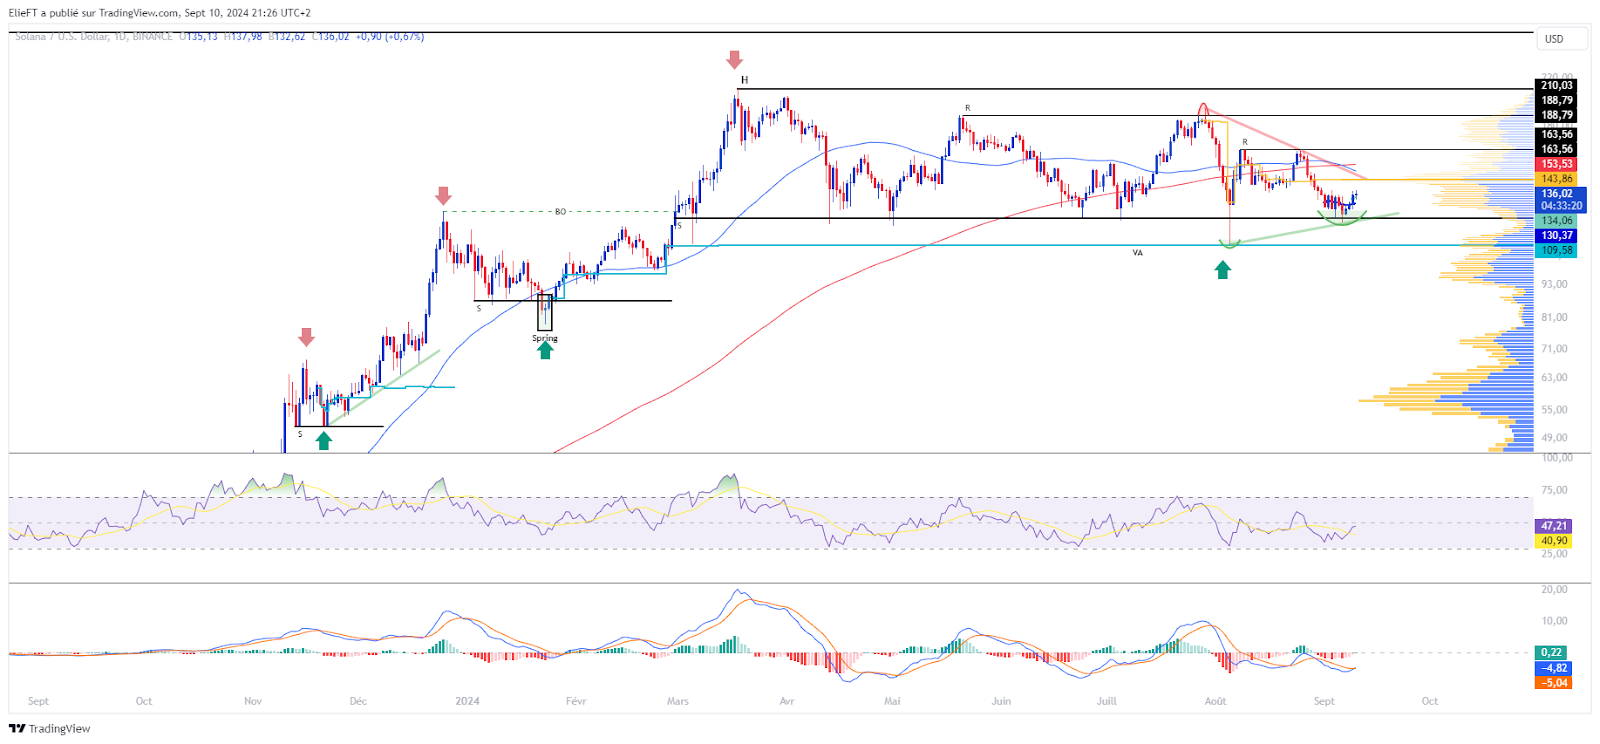
After plunging towards $110 following the overall decline in financial markets, Solana quickly repositioned itself above its identified support around $120. Indeed, the crypto was able to rebound by 48% to reach $164. Unfortunately, this last level served as resistance. Indeed, from this last price level, Solana suffered a drop in its price to $120. Fortunately for the crypto, it seems that buying interest has once again emerged at this level, highlighting its importance as a key level.
At the time of writing, Solana is trading around $135. The recent buying interest in SOL suggests a bullish reversal in the crypto’s short-term trend. However, the medium- to long-term bullish trend continues to weaken, which by definition fuels uncertainty about its possible continuation. This can be reinforced by the fact that the crypto is below its 50-day and 200-day moving averages, which recently formed a “death cross.” In terms of the crypto’s momentum, it can be seen that it is generally revised downward, although a recent rebound can be noted, both in the price of Solana itself and in its oscillators.
The current technical analysis was carried out in collaboration with Elie FT, a passionate investor and trader in the cryptocurrency market. Now a trainer at Family Tradinga community of thousands of self-employed traders active since 2017. You will find Lives, educational content and mutual assistance around the financial markets in a professional and friendly atmosphere.
Focus on Solana (SOLUSDT) derivatives
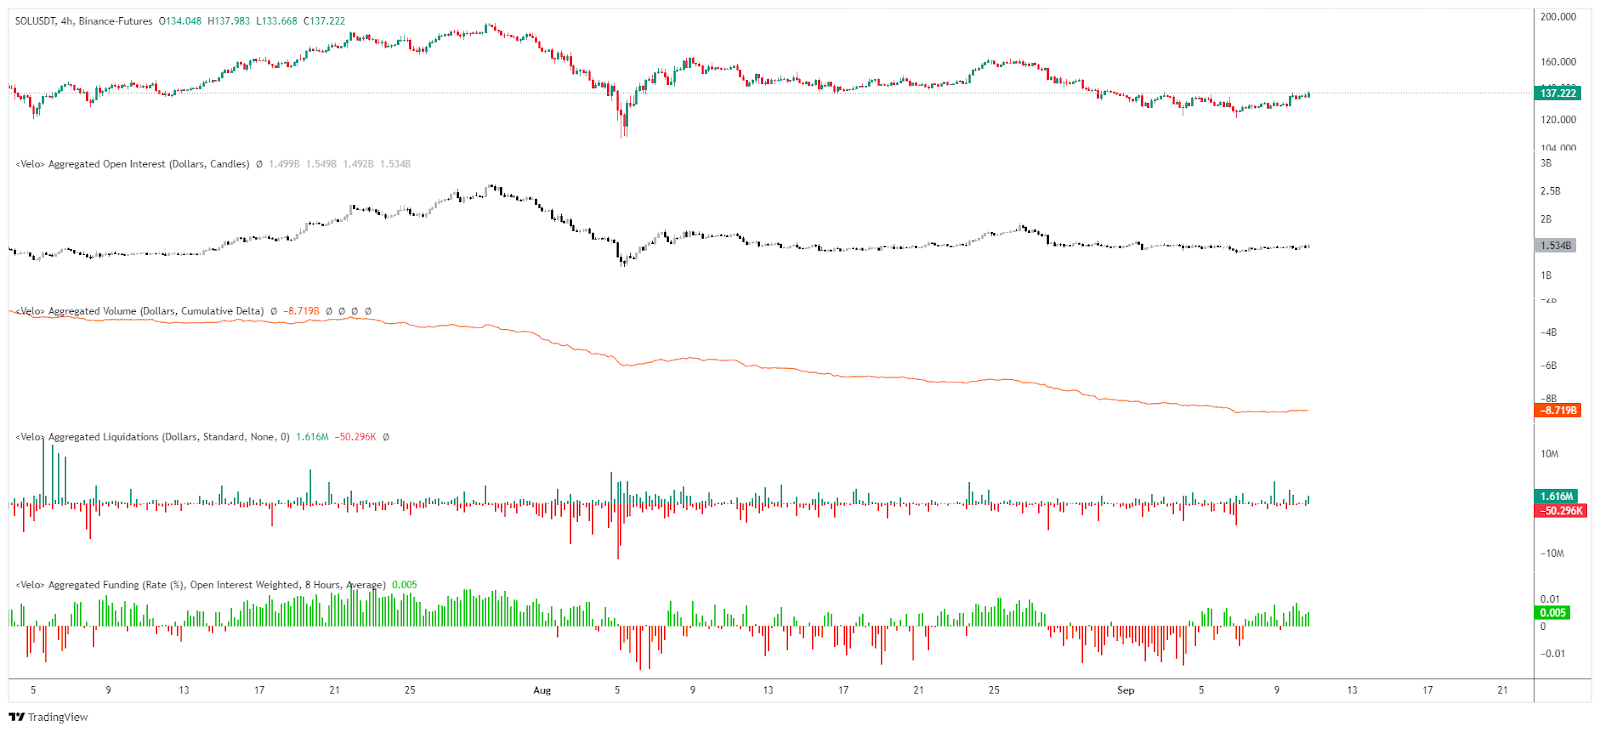
Since Solana’s rally, there has been a positive correlation between SOL/USDT perpetual open interest and its underlying. Interest appears to have been primarily selling, as evidenced by the mostly negative funding rates and decreasing CVD. However, it can be noted that Solana’s latest swings have been accompanied by a slight increase in CVD and a positive funding rate. As for liquidations, there have been as many on the buyer and seller side, with neither being truly significant.
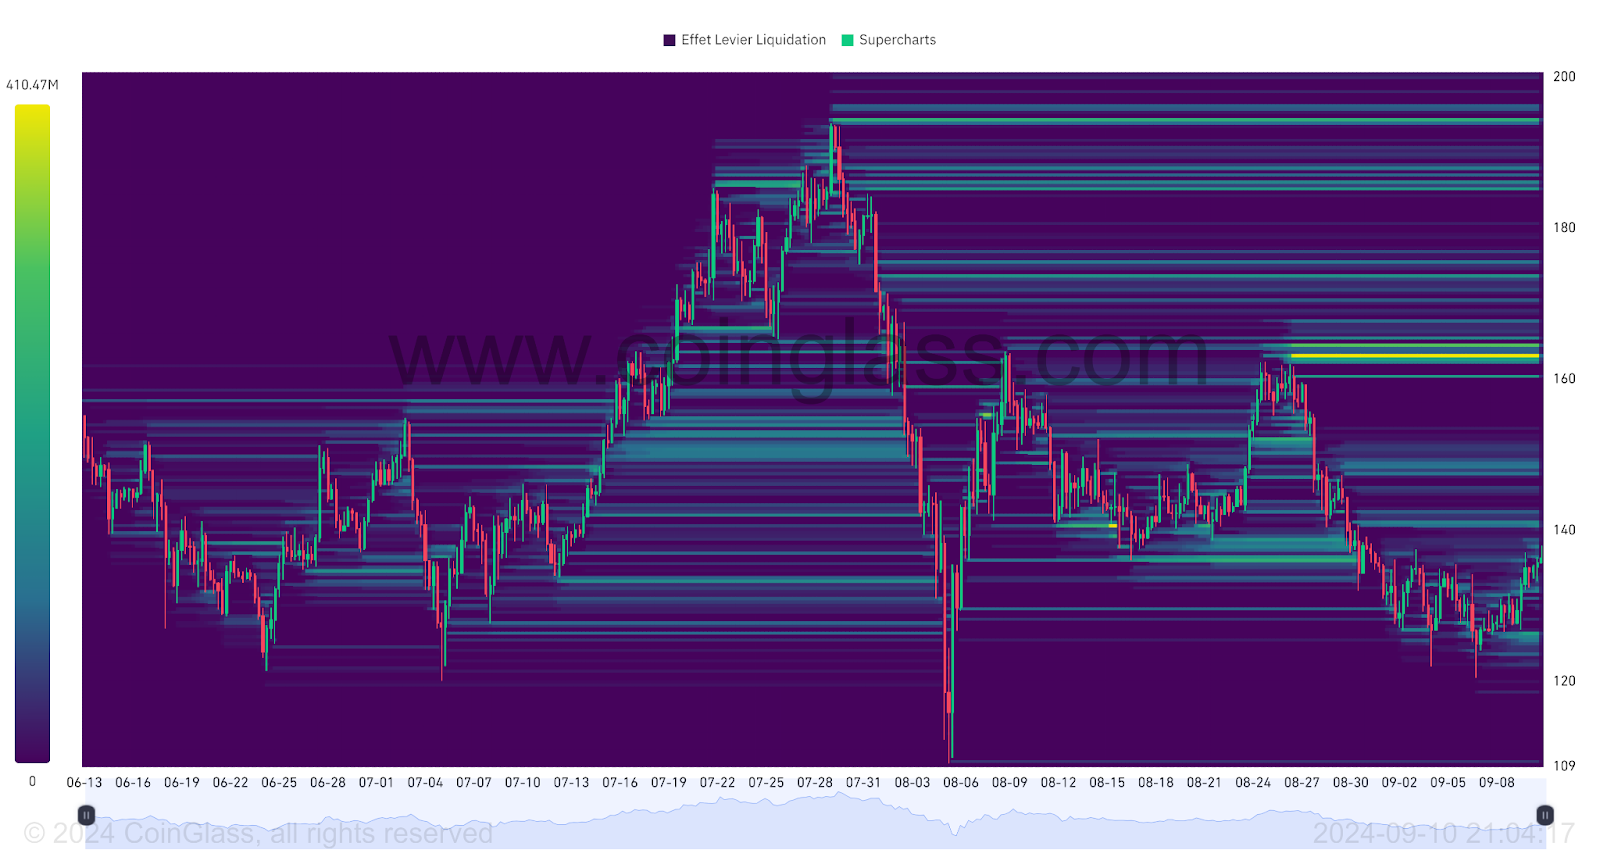
The heatmap of SOL/USDT liquidations over the past three months reveals that the liquidation zone identified around $135 has been breached. Unfortunately, these zones have not attracted significant buying interest, as evidenced by Solana’s bearish continuation. Currently, notable liquidation zones are mainly located above the current price of SOL. We can note the zones around $160, $165, as well as the subtle zone near $174. Further up, we find the $185 zone, followed by the one around $195. Below the current price, we can still note the zone below $126. The approach of the price towards these levels could lead to a massive triggering of orders, thus increasing the risk of increased volatility for the crypto. These zones therefore represent a crucial point of interest for investors.
Solana (SOL) Price Forecast
- If Solana price holds above $120, we could anticipate a bullish continuation up to the $164 level. The next resistance to consider, if the bullish movement continues, could be $190. Beyond that, we can note the last high at $210. At this point, this would represent an increase of more than 52%.
- If Solana fails to hold above $120, we could be looking at a return to the $110 levels. The next support to consider, if the bearish move continues, would be slightly below $100. Further down, we can see the support at $86. At this point, this would represent a decline of around 38%.
Conclusion
Despite a notable rebound, Solana is facing resistance that is slowing its progress. Although there are signs of short-term recovery, the medium and long-term trend remains uncertain, with indicators showing an overall weakened momentum. It will therefore be essential to carefully monitor the price reaction to key levels to validate or revise current forecasts. Finally, let us remember that these analyses are based solely on technical criteria and that the price of cryptocurrencies can also change rapidly depending on other more fundamental factors.
Maximize your Tremplin.io experience with our 'Read to Earn' program! For every article you read, earn points and access exclusive rewards. Sign up now and start earning benefits.