
The cryptocurrency market faces a significant hurdle as several groups of investors seek to regain their purchase price. According to Glassnode, this situation is currently slowing the progression of bitcoin around $87,700. Holders who entered the market in recent months exert selling pressure when prices reach their break-even point. At the same time, on-chain data reveals several levels of support likely to influence the next evolution of the market.

In brief
- Glassnode identifies major resistance at $87,700, linked to the cost price of Bitcoin buyers.
- Holders who have entered the market for six to twelve months increase the selling pressure when the price returns to their purchase price.
- Support for US spot Bitcoin ETFs lies at $81,500, just above the psychological threshold of $80,000.
- A break below $80,000 could cause liquidations before a return to the average market cost price, close to $77,500.
Bitcoin: Recent buyers strengthen resistance at $87,700
A recent study by Glassnode highlights several price levels that limit the progress of bitcoin. Since the start of the year, two groups of investors have notably slowed down attempts to increase. Their purchase prices now serve as benchmarks to understand market reactions. When the price returns to these levels, some holders seek to sell their assets without recording a loss.
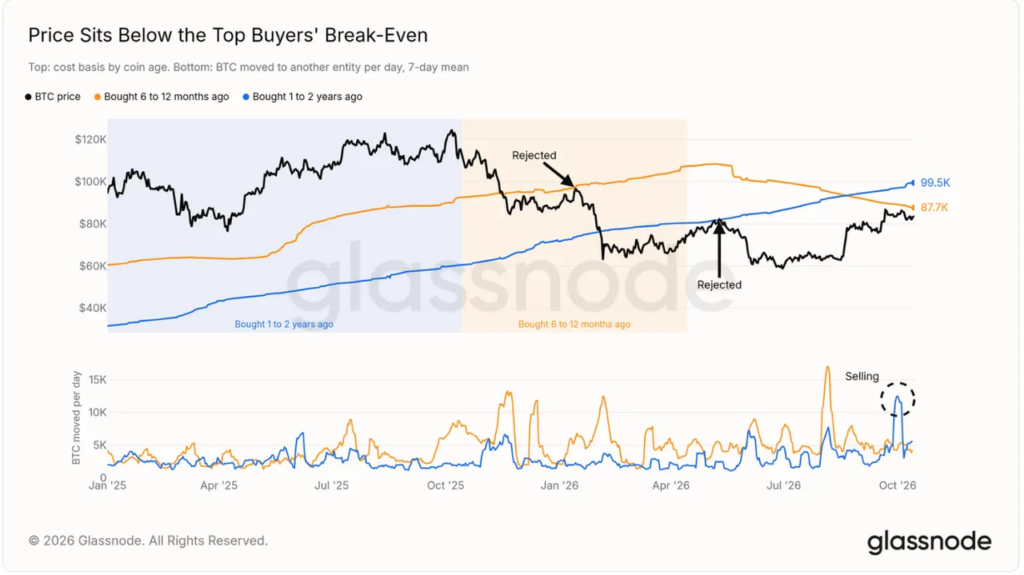
The first group mentioned in the report brings together investors who purchased their BTC between six and twelve months ago. In November 2025, the price fell below their cost price, established at $94,000. Then, in January 2026, a new attempt to rise towards $97,100 ran into this resistance. The market then retreated, illustrating the difficulties encountered in exceeding this level.
The second group includes holders who acquired their assets between one and two years previously. Last February, the market decline put these investors at a loss, with their average purchase price reaching $76,900. In May, this threshold once again slowed down the recoverywhen the price slightly exceeded $82,000. These reactions show how past buying prices can weigh on current movements.
Two investor groups fuel selling pressure
According to Glassnode, investors seeking to break even contribute to the rejections observed at these levels. When an asset returns to its purchase price, some holders take advantage of this opportunity to sell their positions. This additional supply complicates price progression when demand is not sufficient to absorb it. The phenomenon partly explains why several recovery attempts have failed this year.
The report underlines the extent of the corrections after these returns to cost prices. In January, the market reached the threshold of holders at six and twelve months, before losing more than a third of its value. In May, it reached that of investors at one or two years, then fell by about a quarter. Glassnode also indicates that the latter increased their sales during the recovery in early October.
Today, the two cost bases stand at $87,700 and $99,500. The first corresponds to investors who entered six to twelve months previously, while the second concerns those who purchased one to two years earlier. Other landmarks reinforce the concentration of resistance in this area. The 2026 opening price reaches $87,490, while the twenty-month simple moving average stands at $87,165.
This accumulation of levels makes the $87,000 area particularly important for the rest of the movement. The price of bitcoin must exceed these thresholds to reduce the pressure on investors wishing to recover their stake. However, their presence does not guarantee systematic rejection of the course. Developments will also depend on the ability of buyers to absorb sales when the market approaches these prices.
Bitcoin ETFs draw support between $80,000 and $81,500
Below the resistance levels, Glassnode data shows several potential support zones. The cost price of US spot Bitcoin ETFs stands at $81,500. This level represents an important benchmark for evaluating the average position of capital invested in these products. It sits just above the psychological threshold of $80,000.
Glassnode also estimates the true average market cost price at $77,500. This measure corresponds to the cost of acquiring BTC purchased on secondary markets. Further down, the breakeven point for short-term holders sits at $74,600. These levels could become significant if prices continue to fall and further weaken recent positions.
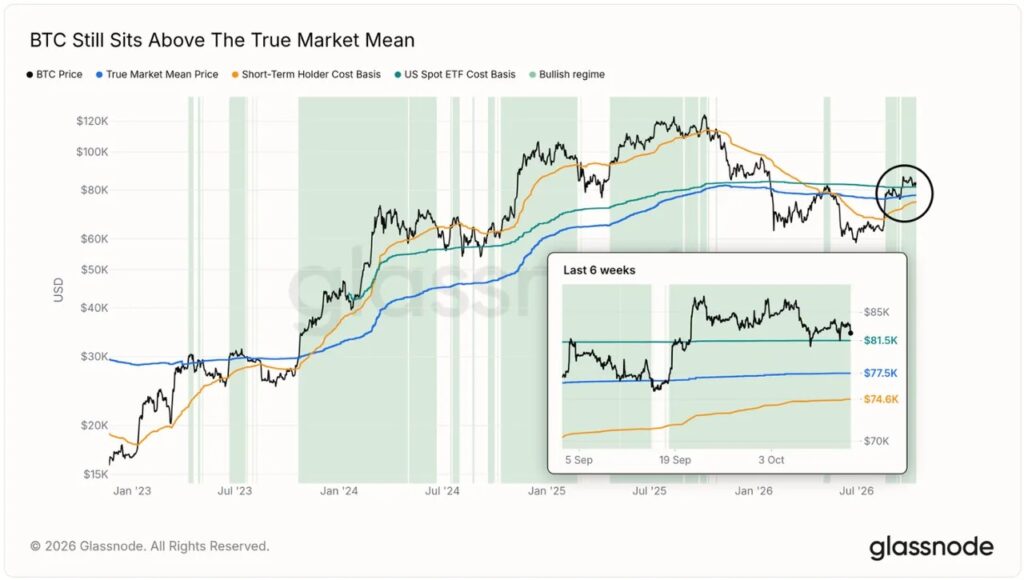
The zone between 80,000 and 81,500 dollars thus brings together orders present in the platforms’ books and support identified on the chain. According to Glassnode, a break below this zone could trigger liquidations just below $80,000. The market could then turn towards the average cost price, close to $78,000. This development, however, remains conditional on the reaction of buyers and the intensity of sales.
In the short term, bitcoin therefore finds itself between resistance concentrated around $87,000 and supports located below $82,000. A sustained breach of resistance could ease selling pressure, while a breakdown of ETF support would expose the market to further selloffs. The $81,500, $80,000 and $77,500 levels will remain critical in assessing the strength of demand.
Maximize your Tremplin.io experience with our ‘Read to Earn’ program! For every article you read, earn points and access exclusive rewards. Sign up now and start earning benefits.