

Bitcoin has been pretty quiet the last few days, and I know this kind of market can be frustrating. But there are still a few levels that I’m watching closely. On the daily chart, we lost the 50-day exponential moving average. On the weekly chart, however, we still maintain the 50-week exponential moving average. That’s a significant difference, and why I haven’t changed my overall bullish view. However, I think we could see a further decline first.

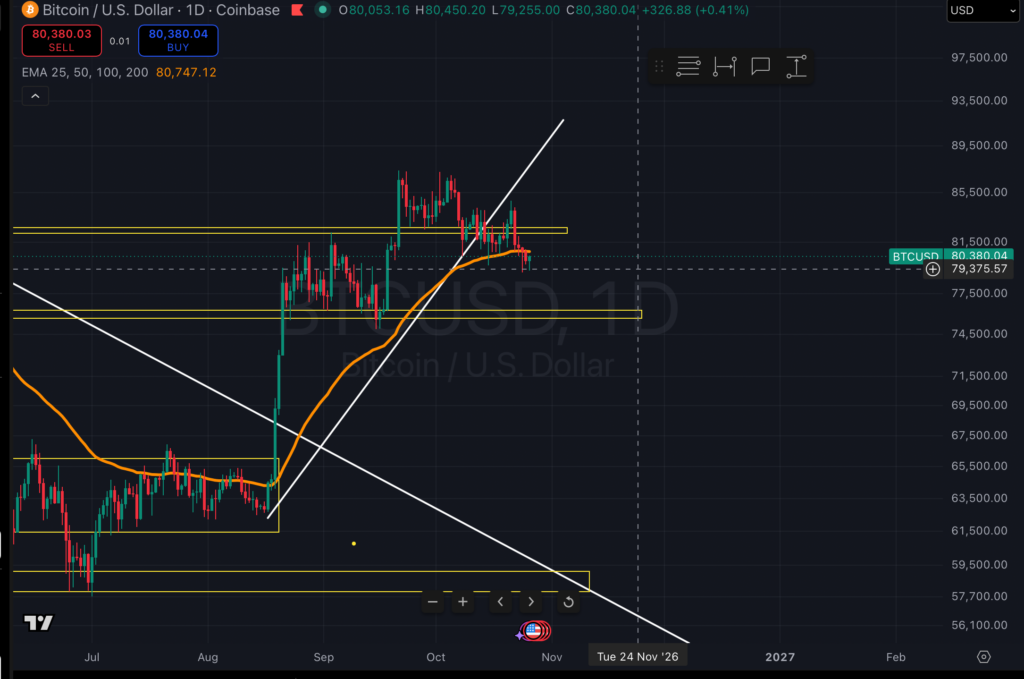
Daily chart: I wouldn’t rule out a move towards $75K
Looking at the daily chart, Bitcoin is trading around $80,000 and has moved below the 50-day exponential moving average. To me, this opens the door for a further move towards $77,000. We could even see a quick foray into the $75,000 zone, or a little below, to pick up some liquidity before a rebound. I’m not saying this has to happen. This is simply a scenario I’m ready for, and I wouldn’t call this another bear market just because price briefly breaks below support.
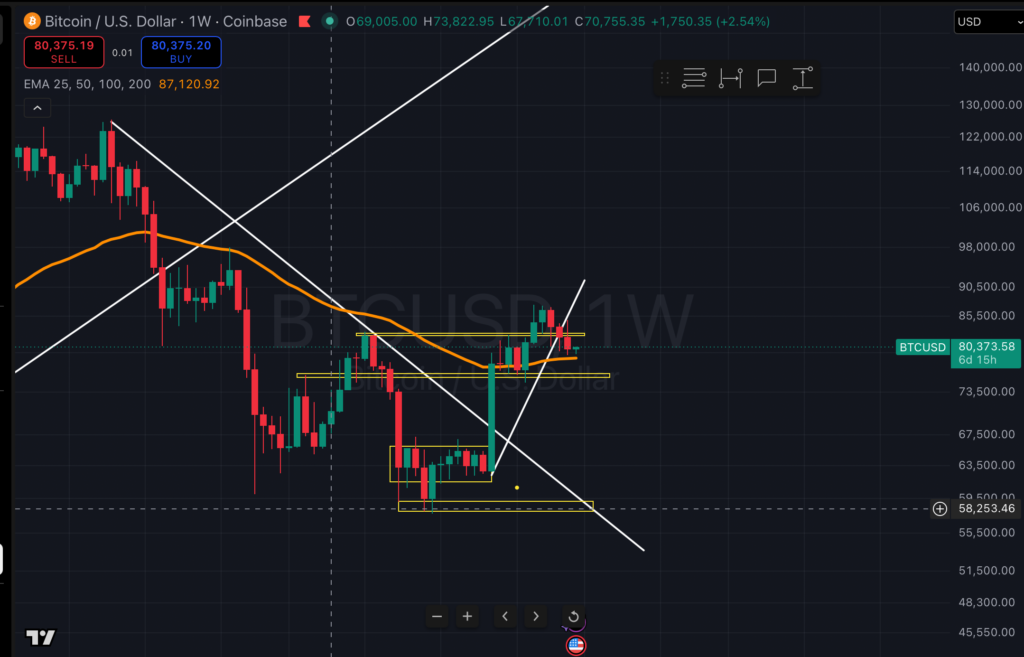
Weekly chart: this is what matters most to me
Now let’s zoom in on the weekly chart and the picture is different. Bitcoin has not lost the 50-week exponential moving average. This is the level I pay the most attention to at the moment. Until we have a weekly candle closing below, I still see room for the bullish scenario to play out. If we close below this exponential moving average, I will need to re-evaluate the setup instead of pretending nothing has changed.
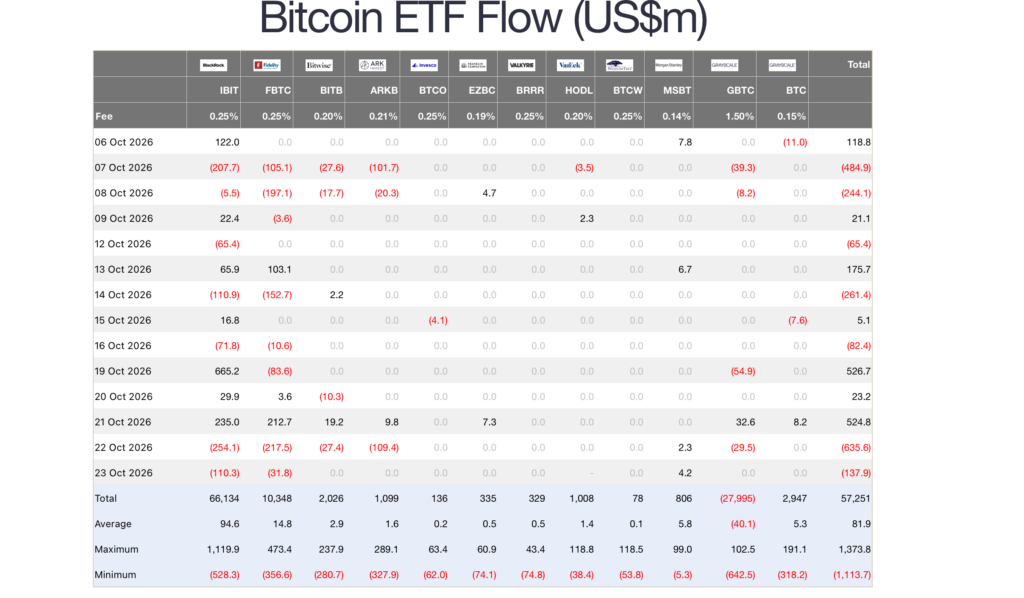
ETF flows are mixed, and the market awaits the Fed
Another reason the market seems so slow is that we are not seeing consistent buying or selling through US spot Bitcoin ETFs. The flows go in both directions. In the numbers I share, October 21 saw $524.8 million in net inflows, but on October 22, $635.6 million went out, followed by another $137.9 million on October 23. To me, this does not show a market with strong conviction in either direction at this time.
And there’s another date on the calendar: October 28, when the Federal Reserve is scheduled to announce its rate decision. I think a lot of traders are waiting to see what happens before taking larger positions. We could see more volatility around this decision, but I won’t try to guess the reaction before the market shows its cards.
What I’m looking for in November: $90K–92K
This is how I see the next few weeks. First, I would not be surprised by a further drop towards $77,000 or even a liquidity take around $75,000. After that, if Bitcoin finds buyers and manages to break through the resistance zone between $85,000 and $87,000, my next target will be $90,000 to $92,000 over the next month. I want to see a real breakout and buyers entering the market, not just a quick wick above resistance sold back immediately.
Conclusion
So yes, Bitcoin has been boring lately. But I don’t think that means the big opportunity is gone. We lost the 50-day exponential moving average, not the 50-week, and that’s why I still lean bullish overall. I’m watching for a possible final swing down, the weekly close against the 50-week exponential moving average, then a convincing breakout between $85,000 and $87,000. If these things fall into place, $90,000 to $92,000 remains my goal for November. If the weekly structure breaks, I will change my vision accordingly.
Maximize your Tremplin.io experience with our ‘Read to Earn’ program! For every article you read, earn points and access exclusive rewards. Sign up now and start earning benefits.