

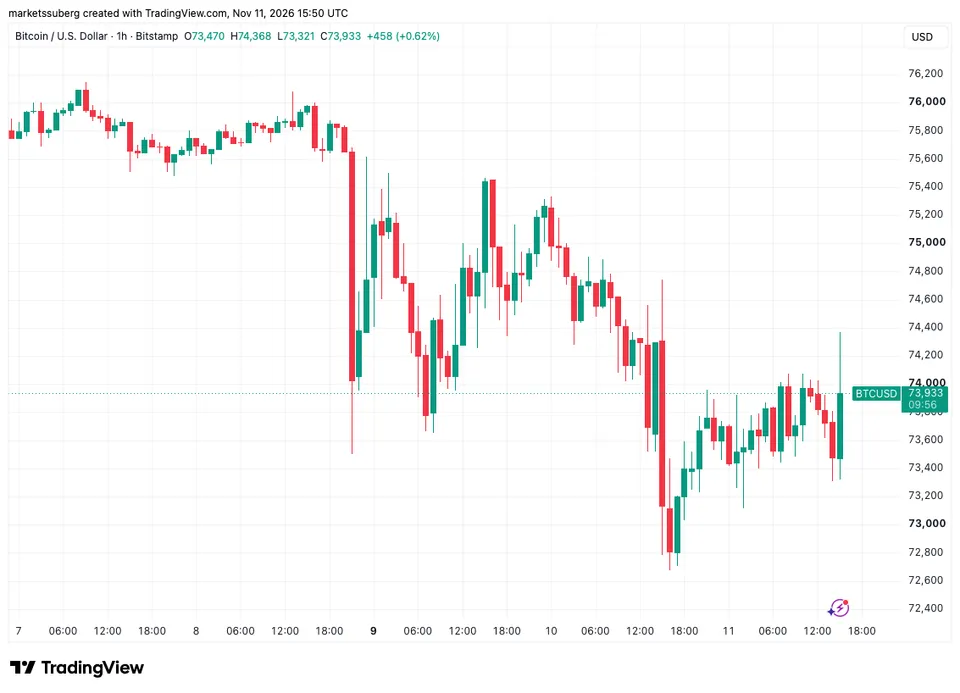
Bitcoin is moving around $74,000, without following the rebound observed on the American stock markets. This divergence comes after the publication of better-than-expected inflation figures, which pushed bond yields higher. At the same time, investors resumed their purchases of certain technology stocks. On the cryptocurrency market, operators are now waiting for a signal capable of taking BTC out of its current zone for investors and relaunching trading.

In brief
- Bitcoin is stagnating around $74,000 despite the rebound in American stock markets.
- Technology stocks are progressing, notably CoreWeave (+20%) and Nvidia (+2.5%).
- The yield on 10-year US bonds has fallen back below 5% after inflation-related tensions.
- BTC is moving between its 21-week ($73,078) and 50-week moving averages ($75,492).
- Short-term holders moved more than 47,000 BTC to exchanges, fueling sell-off fears.
Tech stocks rebound despite rate tensions
TradingView data relayed by Cointelegraph shows that the price of bitcoin/USD has moved against the trend of stocks. While technology stocks have recovered, BTC has remained in a narrow range. Investors took advantage of the decline in several stocks to resume their purchases. The artificial intelligence sector led this reboundnotably thanks to CoreWeave, whose stock gained more than 20% after quarterly revenues above expectations and an increase in forecasts for 2026.
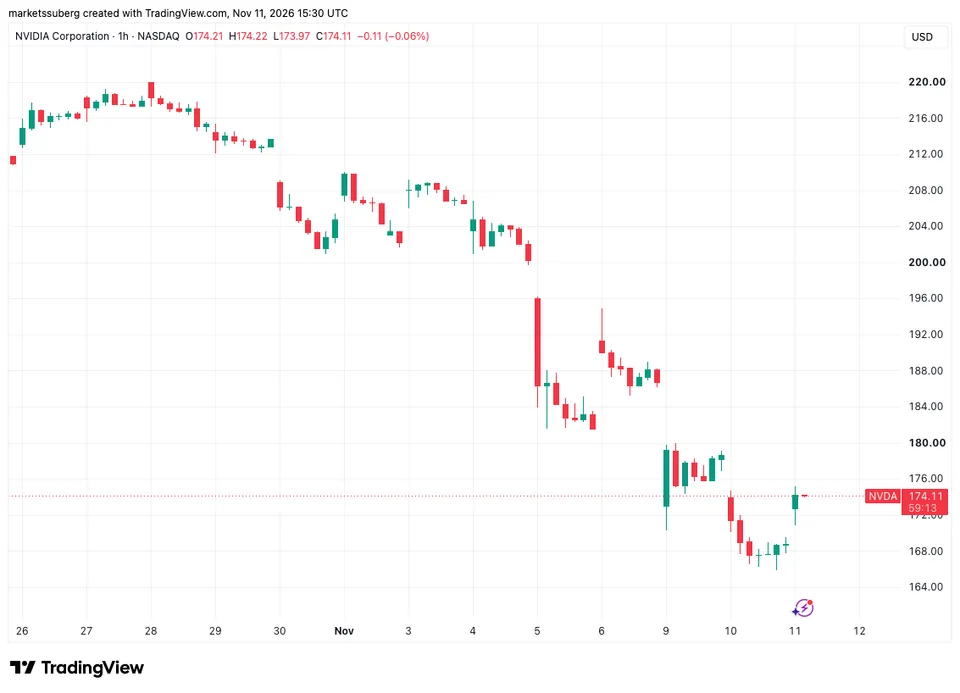
Nvidia also opened up about 2.5%, after falling Monday and Tuesday amid controversy over Jensen Huang. At the same time, oil prices rose as hope for a diplomatic solution to the Iranian conflict diminished. Attacks on ships in the Strait of Hormuz are making it difficult to return to normal traffic. LSEG Oil Research points out that an agreement would not be enough: mine clearance, insurance and the will of shipowners remain decisive.
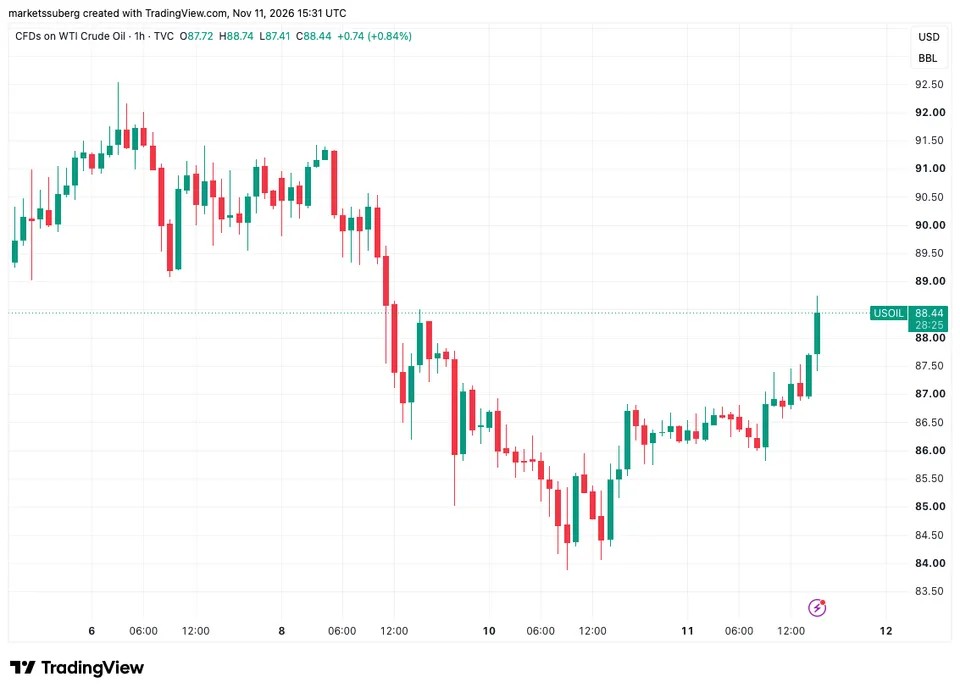
WTI gained 1.4% to $87.70 a barrel, after reaching $84 on Tuesday. This level marked its lowest price since the end of August. Brent rose 1.5% to $93.40. At the same time, consumer price index figures published Tuesday beat expectations and sent bond yields higher. On Wednesday, the ten-year rate fell below 5%, a first since October 29, while the thirty-year rate reached 5.378%.
US inflation keeps pressure on markets
Peter Boockvar, investment director at One Point BFG Wealth Partners, estimated that bonds are already anticipating tighter policy from the Federal Reserve. Markets are pricing in an increase of 0.25 points in December, while the probability of an increase of 0.5 points is increasing. This outlook weighs on rate-sensitive assets and helps explain why bitcoin is not benefiting from the stock rally. Investors therefore follow both returns and movements specific to the cryptocurrency market.
Bitcoin is moving between its 21- and 50-week simple moving averages, located at $73,078 and $75,492, respectively. Bitcoin remains caught between these two benchmarks, without movement marked enough to confirm an exit from the range. Volatility declined after the release of inflation data, as investors wait for a new catalyst. This technical zone places BTC near $74,000 and keeps the focus on thresholds that could direct the next trend.
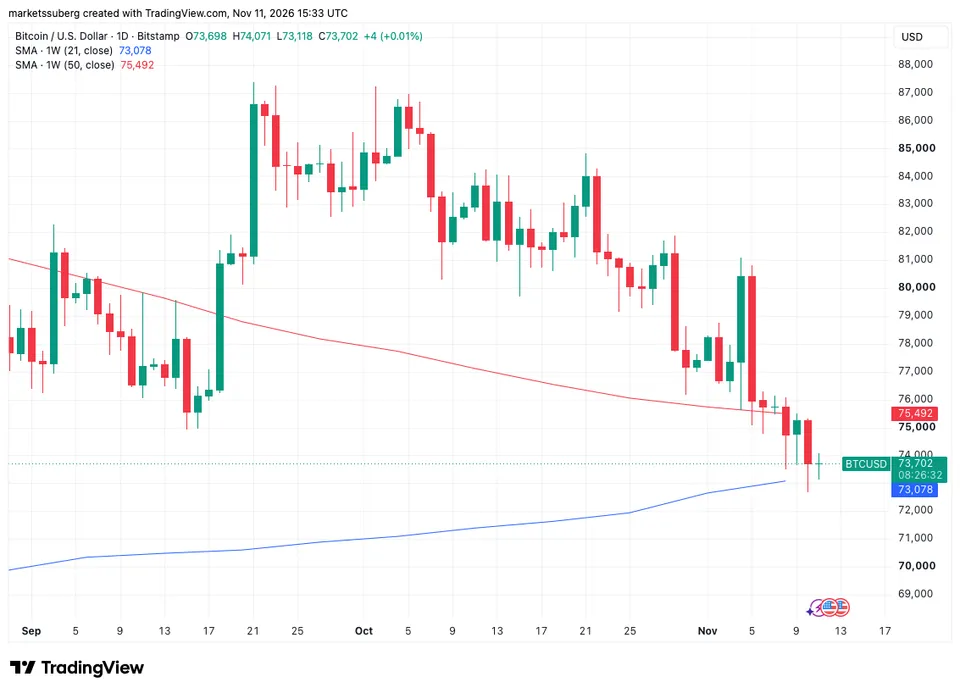
The loss of support located around $75,700, however, weakened the profitability of short-term holders. Their overall cost basis is the average price at which these investors acquired their bitcoin holdings. This category includes entities that hold their assets for a period of 155 days without selling. When the price falls below their average purchase price, their positions show unrealized losses and psychological pressure can increase.
Short-term holders increase pressure on Bitcoin
On Tuesday, the portfolios of these holders transferred more than 47,000 units of bitcoin to exchange platforms. These movements were accompanied by latent losses and could herald an increase in supply for sale. However, a deposit on a platform alone does not confirm a sale: investors may move their assets for other reasons. Thus, the flows of short-term holders constitute an indicator to follow to measure pressure on the market.
These transfers take place while the price remains below the level of 75,700 dollars. The holders concerned can therefore seek to limit their losses if the trend deteriorates. However, the available data does not confirm that these movements will automatically lead to new sales. The evolution of deposits on platforms and moving averages will make it possible to better measure investors’ intentions.
In the short term, maintaining the BTC price above the 21-week moving average could preserve the current zone. A break below this level would on the contrary reinforce the pressure, while a return above the 50-week average would offer a more favorable signal. Bitcoin could thus remain close to $74,000 as long as markets await clarification on rates and flows from short-term holders do not show a clear direction.
Maximize your Tremplin.io experience with our ‘Read to Earn’ program! For every article you read, earn points and access exclusive rewards. Sign up now and start earning benefits.