
A few weeks before the major October correction, I argued in my market analyzes that the bull market was over. I recommended selling all positions around $120,000because I thought we were entering a bear market. My point of view has not changed since then. Small rallies followed by sharp pullbacks are completely normal during a bear market.

Key Points
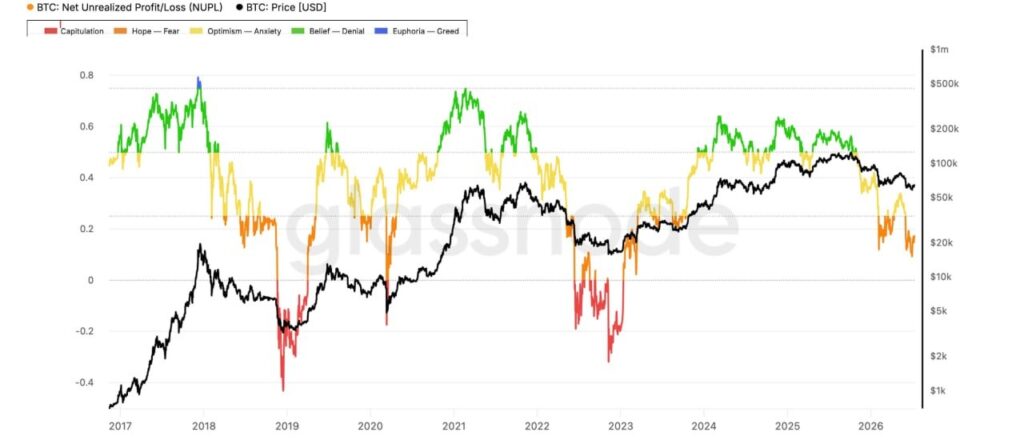
- The NUPL indicator suggests that Bitcoin has not yet reached the capitulation phase that typically marks a market bottom.
- Low ETF inflows and a bearish pricing structure indicate that institutional conviction remains limited.
- The resistance zone between $64,000 and $65,000 is critical, further rejection could trigger deeper selling.
One of the indicators on-chain most reliable for identifying market capitulation is the Net Unrealized Profit/Loss (NUPL). This metric measures the difference between the unrealized profits and losses of all Bitcoin holders, helping to identify periods of euphoria, optimism, fear and capitulation.
Historically, this indicator has not only proven to be very accurate, but it has also highlighted some of the best buying opportunities.
Currently, many investors are buying out of fear of missing the boat, interpreting each rebound as the start of a new bull market. However, history shows that bear markets usually end with a capitulationwhen even the most optimistic participants finally give up their positions—not during times of fear.
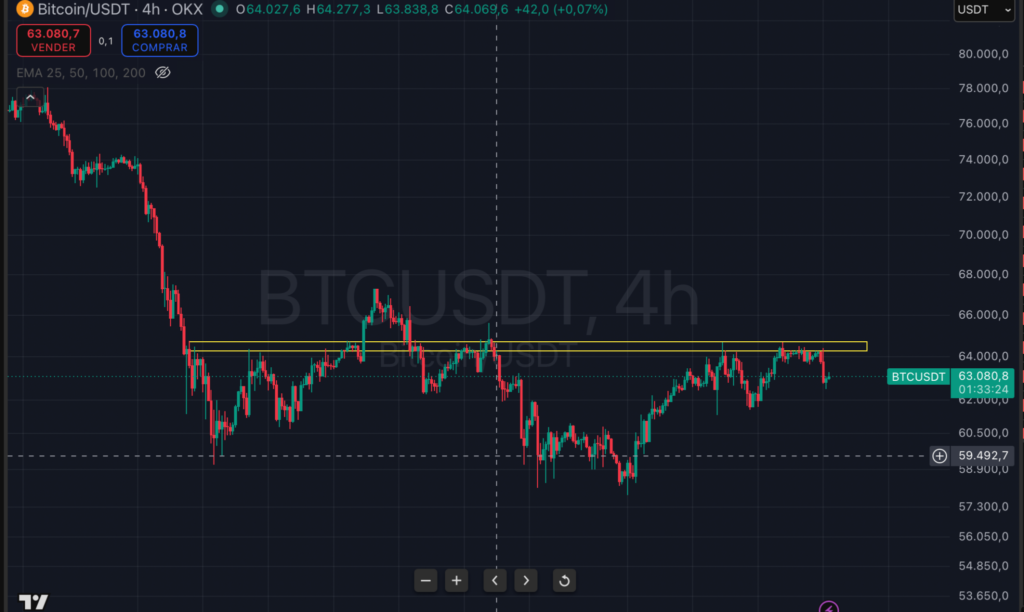
Bitcoin is currently moving in a sideways range, repeatedly testing the resistance zone of $64,000 – $65,000which has held since the beginning of June. So far, buyers have failed to generate enough momentum to break through this level.
At the same time, several indicators already suggest that the market is approaching a bottom. A confirmed daily close above resistance could trigger a short-term rally towards the zone of $68,000 – $70,000.
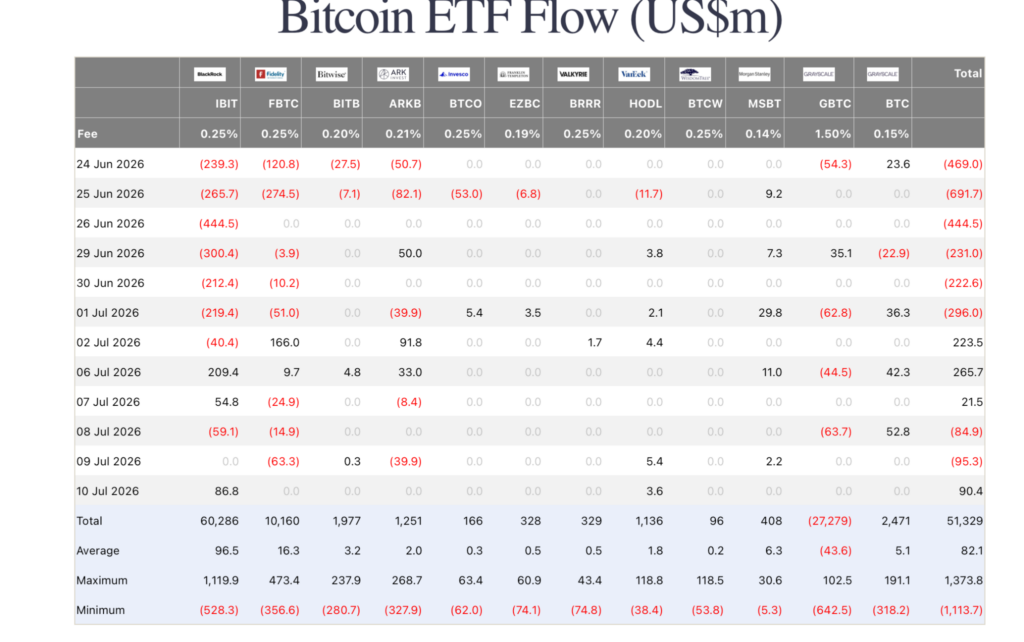
Bitcoin spot ETFs remain a key indicator of institutional sentiment, but they should never be analyzed in isolation. Combined with price structure and on-chain metrics, they always reinforce my primary market perspective.
Many investors believe that because Bitcoin ETFs continue to receive inflows, the market has already bottomed. I don’t agree.
What really matters is not isolated flows, but a constant and growing flow of institutional capital. For now, we continue to see days with large outflows, suggesting that large institutional players are still not accumulating with the typical conviction seen at the start of a new bull market.
Until ETF inflows turn consistently positive and the technical structure remains bearish, I continue to view all rallies as temporary rebounds in a broader downtrend.
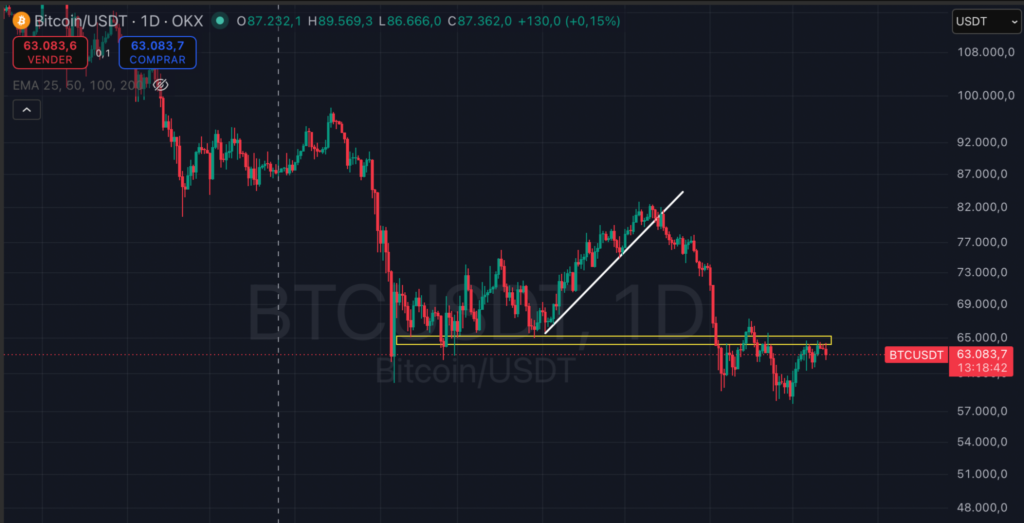
The area $64,000 – $65,000which served as major support for much of 2026, is now key resistance after breaking out in June.
As long as Bitcoin continues to show decreasing troughs and peaksthe main trend remains bearish. If the price is rejected from this zone again, selling pressure could intensify and push the market into a true capitulation phase, where even the most optimistic investors begin to give up.
The price action is currently playing out exactly this way and appears to be exhausting market participants. And what happens during the next major decline? Exhausted investors will start to give up because they simply cannot take the situation any longer.
Ask yourself: how would a completely destroyed bull feel?
Maximize your Tremplin.io experience with our ‘Read to Earn’ program! For every article you read, earn points and access exclusive rewards. Sign up now and start earning benefits.