
After its correction, Suis displays very encouraging technical signals. Find our complete analysis and current technical perspectives.

In short
- Technical analysis: SU consolidates after a sharp increase. The trend remains upward in the medium and long term, with a revival of momentum.
- Key levels: maintenance above $ 3 confirms a bias bias. Resistors at $ 3.87 and $ 4.30; Supports between $ 3.12 and $ 1.87.
- Analysis of derivatives: Open Interest is increasing, while the CVD is receding, signaling an absorption of the sellers. Balanced liquidations, absence of clear bias on the market.
- Forecasts: bias bias above $ 3.12 with targets around $ 4.30. Below, risk of withdrawal around $ 2. Macroeconomic context to monitor.
Technical analysis of the Su
| Indicator | State | Comment |
| Spot price | ≈ $ 3.65 | Sui stabilizes, evolving in a consolidation phase after a previous increase. |
| Latest weekly variations | – 8 % | Such marks a decline, contrasting with the increase of 70 % recorded the previous week. |
| Latest weekly spot volumes | ≈ 2.9 billion (-44%) | The activity on the SPOT market shows a clear breath, reflecting a renewed wait -and -see by investors. |
| Long -term trend (SMA 200) | Upward | Upward structure supporting a positive long term bias. |
| Medium -term trend (SMA 50) | Upward | Bullish resumption after a correction phase. |
| Short -term trend (SMA 20) | Neutral | The trend is neutral, but recently suggests a bullish recovery. |
| Momentum | Neutral | Neutral momentum, contrasting with its previous rebound, indicated by the oscillators. |
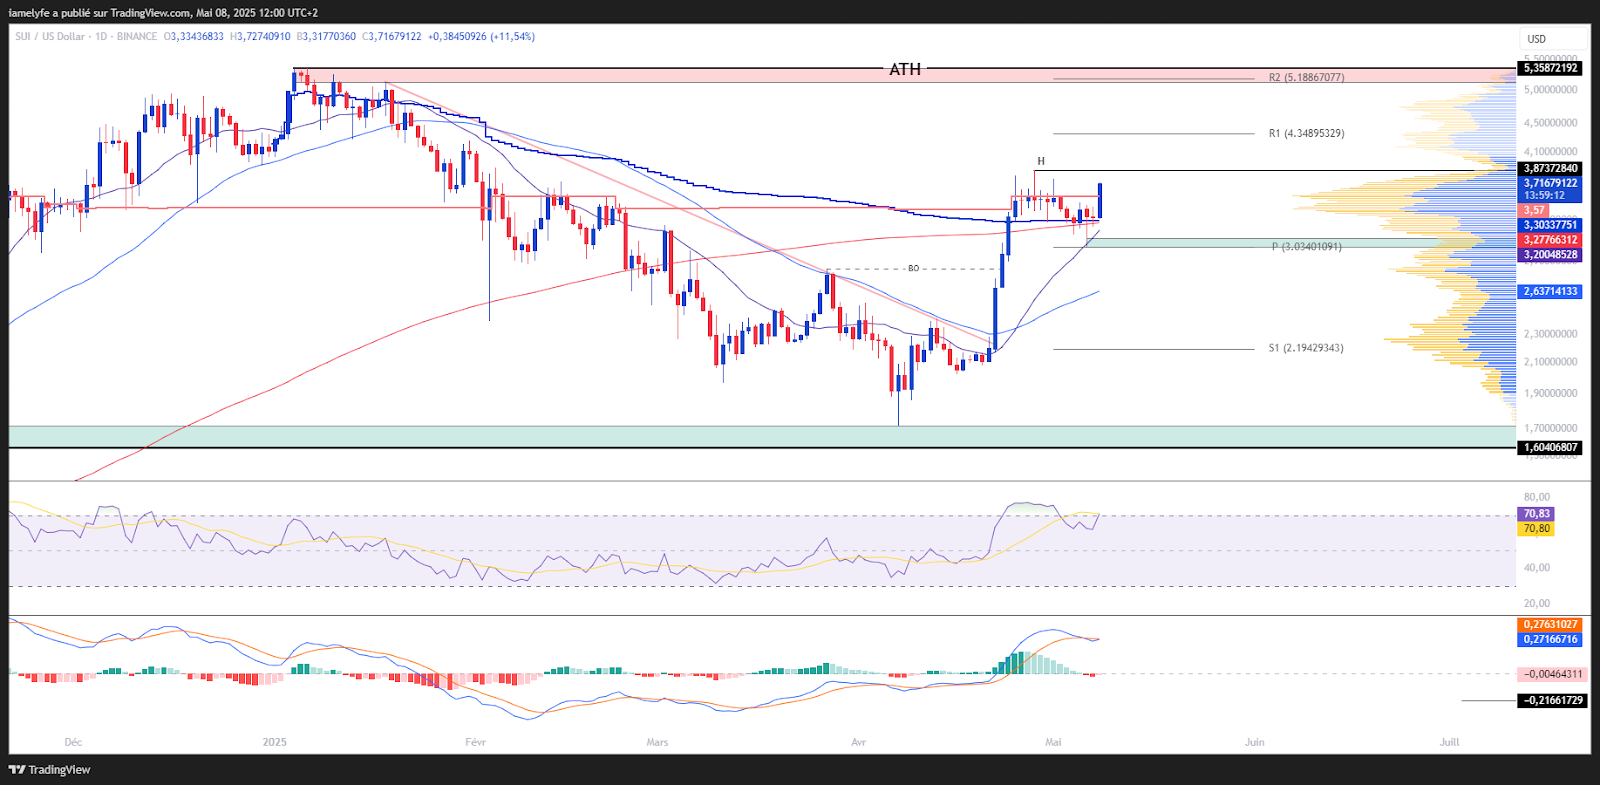
Suis stabilizes around $ 3.65, in the consolidation phase after a previous upward impulse. Over the week, the asset has a drop of 8 %, contrasting with the increase of 70 % recorded the previous week. The weekly spot volumes retreat from 44 % to 2.9 dB, signaling a clear drop in activity and a marked wait -and -see waitpath.
Mobile averages indicate an upward trend on the long (SMA 200) and medium term (SMA 50), supporting a positive structure. In the short term (SMA 20), the trend is neutral, but shows signs of recovery. The momentum remains neutral, contrasting with the previous increase, but with an emerging rebound detected as much by the oscillators as by the price of the Su.
Technical levels of the suis
| Indicator | State | Comment |
| Resistance | $ 3.87 $ / $ 4.3 / $ 5.1 – $ 5.36 (ATH) | Critical areas, potential distribution thresholds. |
| Support | $ 3.12 / $ 2.8 / $ 2 / $ 1.87 | Major defense levels, probable accumulation zones. |
| Last daily break | $ 2.8 | Resistance crossed; Strengthening of the bias bias. |
| Monthly pivot | $ 3 | Reference level for the trend of the month below the course. |
| High value area | $ 3.23 | High volume area; Upper terminal of a market balance, beyond which an imbalance can emerge. |
| Low value area | $ 1.74 | High volume area; Low limit of a market balance, beyond which an imbalance can emerge. |
Followed above his monthly pivot point at $ 3, strengthening a bias bias confirmed by the break of $ 2.8. Resistors at $ 3,87, $ 4.3 and up to ATH $ 5.36 represent key distribution thresholds. The supports between $ 3.12 and $ 1.8 are major accumulation areas. The high value area at $ 3.23 marks a border of equilibrium, beyond which a bullish imbalance could be triggered, while the low value zone at $ 1.74 plays this role down.
Current technical analysis was carried out in collaboration with ElyfeAnd 0xhugzerinvestors and popularizers on the cryptocurrency market.
Derivative analysis (SU/USDT)
| Indicator | State | Comment |
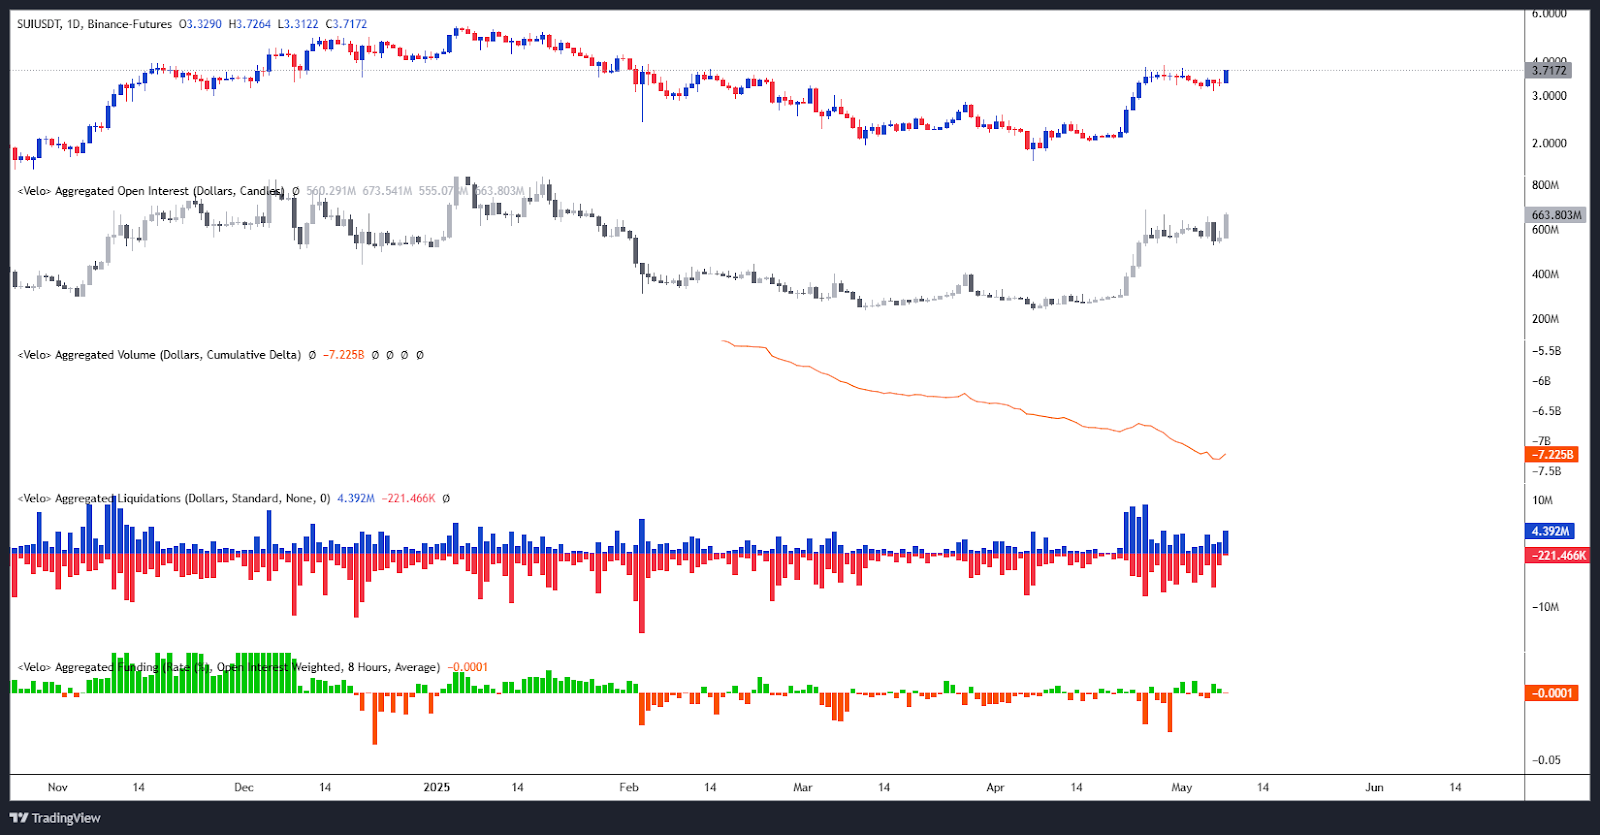
| Open Interest | Increase | The open interest has increased significantly before stabilizing, which constitutes a clear signal of a renewed speculative engagement. |
| CVD | TRADE ABSERMENT | The CVD is retreating, but the price remains stable, indicating a buying resistance in the face of the selling pressure. |
| Liquidation | Moderate, balanced | The liquidations are significant on both sides, without a clear domination of a camp, a sign of a restless but generally balanced market. |
| Funding Rate | neutral | Stable funding: absence of imbalance between buyers and sellers. |
The market shows signs of growing activity, with a renewed speculative commitment reflected by the rise in open interest. The declining CVD, without prices withdraw, suggests a selling pressure absorbed by passive buyers. The liquidations remain marked, but balanced between the two camps. Finally, the Standing Lifting Stable reflects an absence of clear directional bias in leverage traders.
| Indicator | State | Comment |
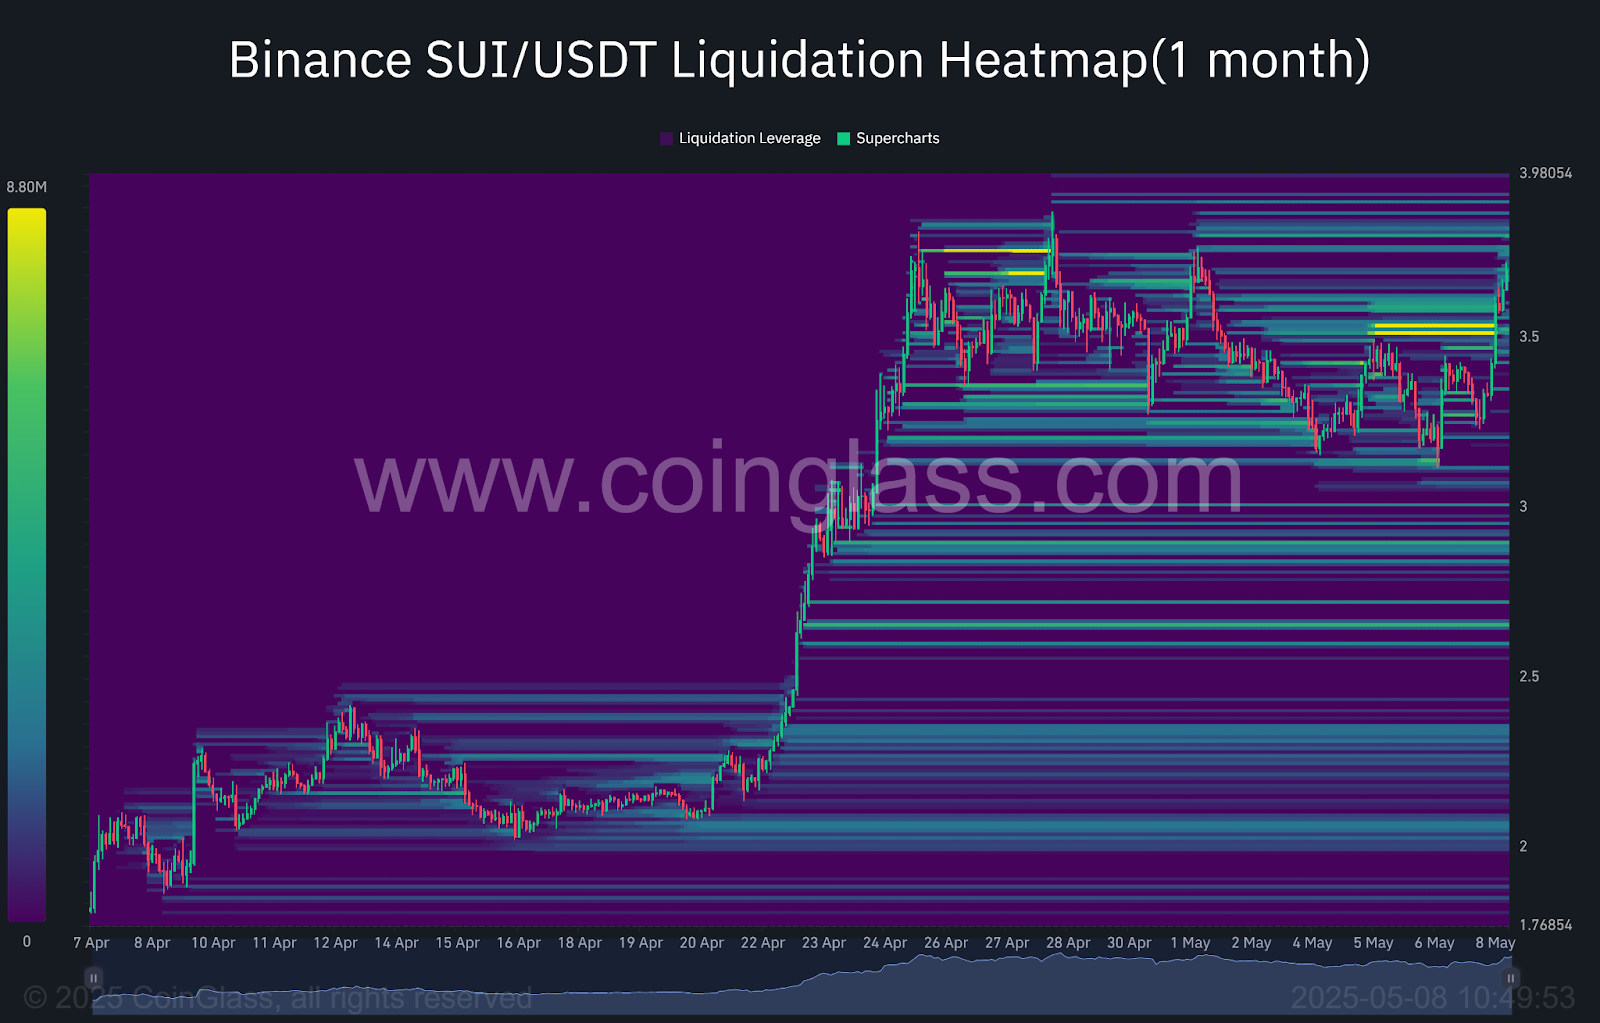
| Selling liquidation zone | ≈ $ 3.77 – $ 3.83 / $ 3.92 | Order concentration area; The achievement of these levels could result in an acceleration of volatility. |
| Buyer liquidation area | ≈ 3.00 $ / $ 2.90 / $ 2.01 – $ 1.99 | Order concentration area; The achievement of these levels could result in an acceleration of volatility. |
Selling liquidation areas are identified between $ 3.77 at $ 3.83 and around $ 3.92, representing liquidity pockets likely to cause upward acceleration if they are reached. Lowering, the buying liquidation areas are around $ 3.00, $ 2.90, and between $ 2.01 to $ 1.99, which can also cause increased volatility in the event of orders.
Forecasts for the course of the suis
Haussier scenario:
- Conditions: Maintaining above $ 3.12.
- Objectives: $ 3.86 / $ 4.30 / $ 5.12 / 5.35 (ATH).
- Potential: approximately +45 % since the current level.
Lower scenario:
- Conditions: breaking the support at $ 3.12.
- Objectives: $ 2.8 / $ 2 / $ 1.87.
- Potential: decrease of up to -50 %.
Comment :
The bias on the sui remains bullish as long as its course is maintained above its support. The next economic publications, in particular those related to inflation in the United States, could mark a decisive turning point and condition the validation of this scenario.
Conclusion
SU shows signs of stabilization after a sharp increase, despite a slight recent withdrawal. The trend remains generally positive, with a recovery potential if the current support is due. However, the market remains wait -and -see, and evolution will also depend on the macroeconomic context to come. In this context, it will be essential to closely monitor the reaction of prices at strategic levels in order to confirm or adjust current forecasts.
Finally, remember that these analyzes are based solely on technical criteria, and that the course of cryptocurrencies can evolve quickly according to other more fundamental factors.
Has this study interested you? Find our latest XRP analysis.
Maximize your Cointribne experience with our 'Read to Earn' program! For each article you read, earn points and access exclusive rewards. Sign up now and start accumulating advantages.