After marking a summit at $ 19.5, the United Stateswap price has dropped, bringing it below $ 10. Discover the analysis of Elyfe and dissect the technical perspectives of the united token.

Uniswap situation (UNI)
After rebounded above the $ 5.6, Uniswap returned to interest at the end of 2024, allowing its course to cross the resistance of $ 17. This movement led cryptocurrency to seek a new summit identified with $ 19.50. However, the achievement of this level caused a selling pressure, amplified by the overall decrease in the crypto market, which impacted the course of the UNI. The token first joined the $ 12 support, before giving in and falling to the $ 7 zone, a key level supported by a significant value area, located just below the second monthly pivot support.
The damage of this last level has obviously triggered a buyer interest, which seems to be maintained until today. Indeed, at the time of the editorial staff, the Uniswap course oscillates above $ 8.8.
Although this rebound may seem encouraging, it should be noted that the medium -term trend remains down. This dynamic is illustrated by the 50 -day mobile average, as well as by the annual VWAP, which are clearly oriented. However, the long -term trend remains upward.
Regarding the upward dynamics of Uniswap, it is not surprising that it was questioned, although a rebound is observable. The latter is accompanied by a slight renewed interest in buyers, visible through its price and the evolution of its oscillators.
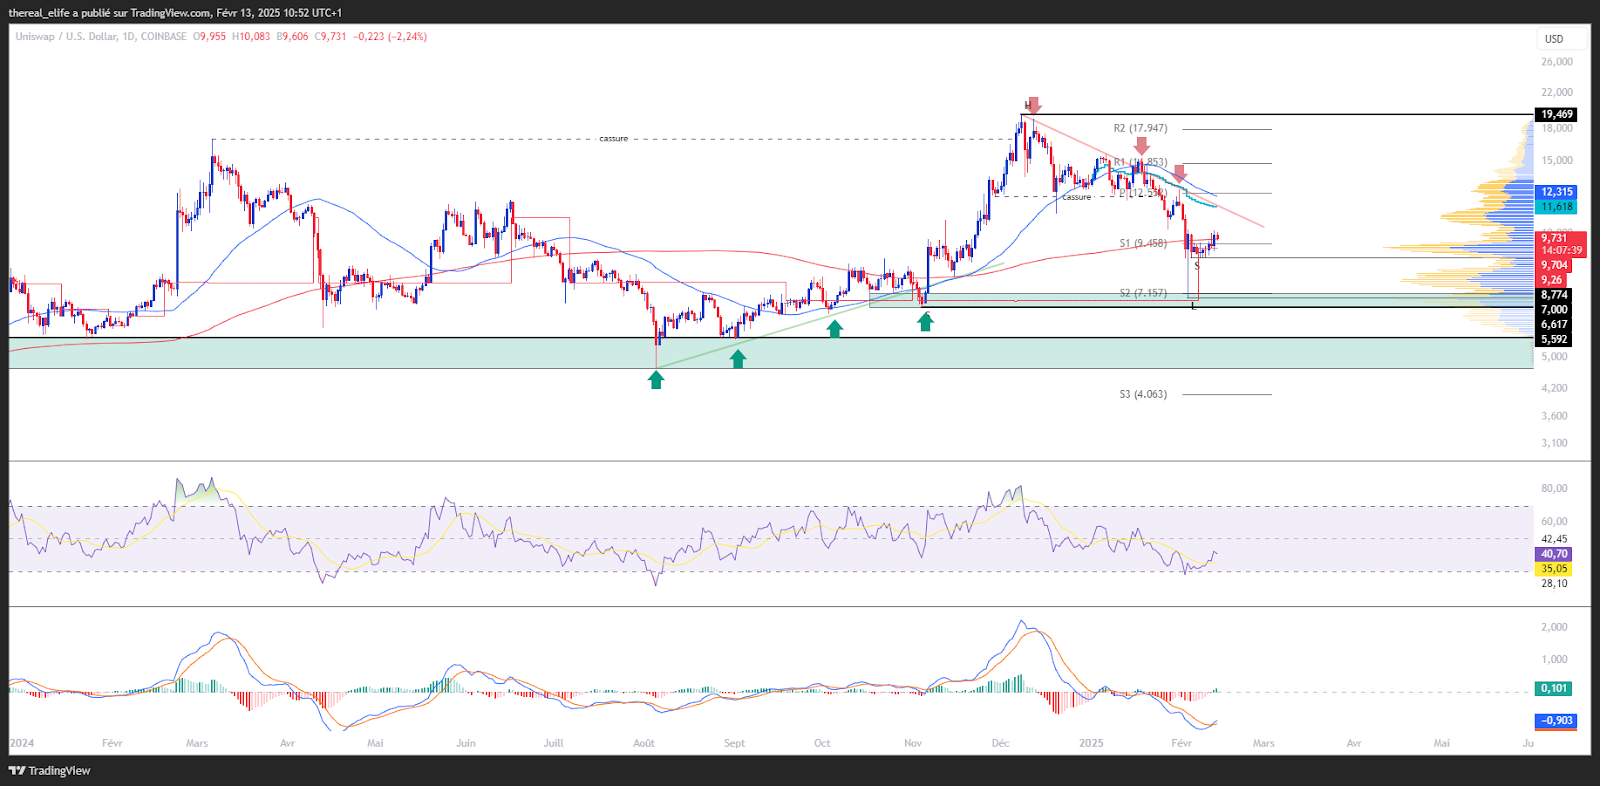
Current technical analysis was carried out in collaboration with Elyfeinvestor and popularizer in the cryptocurrency market.
Zoom on uniswap derivatives (UNI)
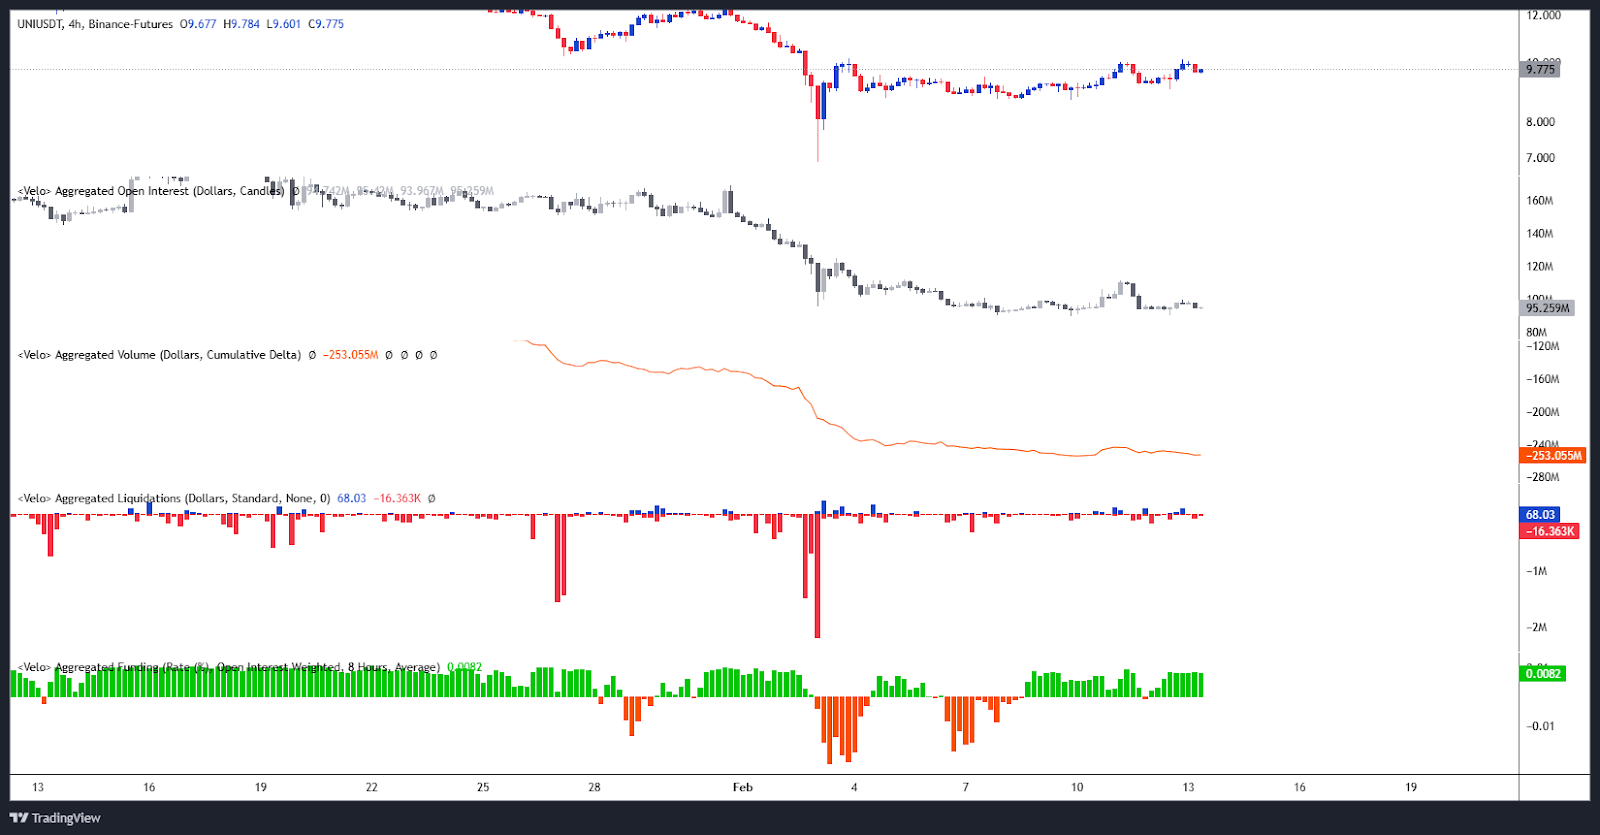
The open interest of UNI/USDT perpetual contracts recently decreased before stabilizing in early February, while the United Stateswap price has grown slightly. This divergence suggests lightening selling positions, reducing downward pressure without reporting a significant influx of new buyers. Thus, the resumption of the price remains fragile and could lead to a consolidation phase pending a catalyst to confirm the future trend.
CVD analysis shows that it remains in a downward trend, although it displays signs of stabilization. This suggests a predominance of selling orders, but with pressure that gradually tends to fade.
The financing rate has returned to positive territory, reflecting a new upward conviction in progress.
Finally, since February 3, liquidations have remained limited on both sides of the market, without significant movement or for buyers or for sellers. This testifies to a stable market, controlled volatility and prudent risk management, reflecting a certain balance.
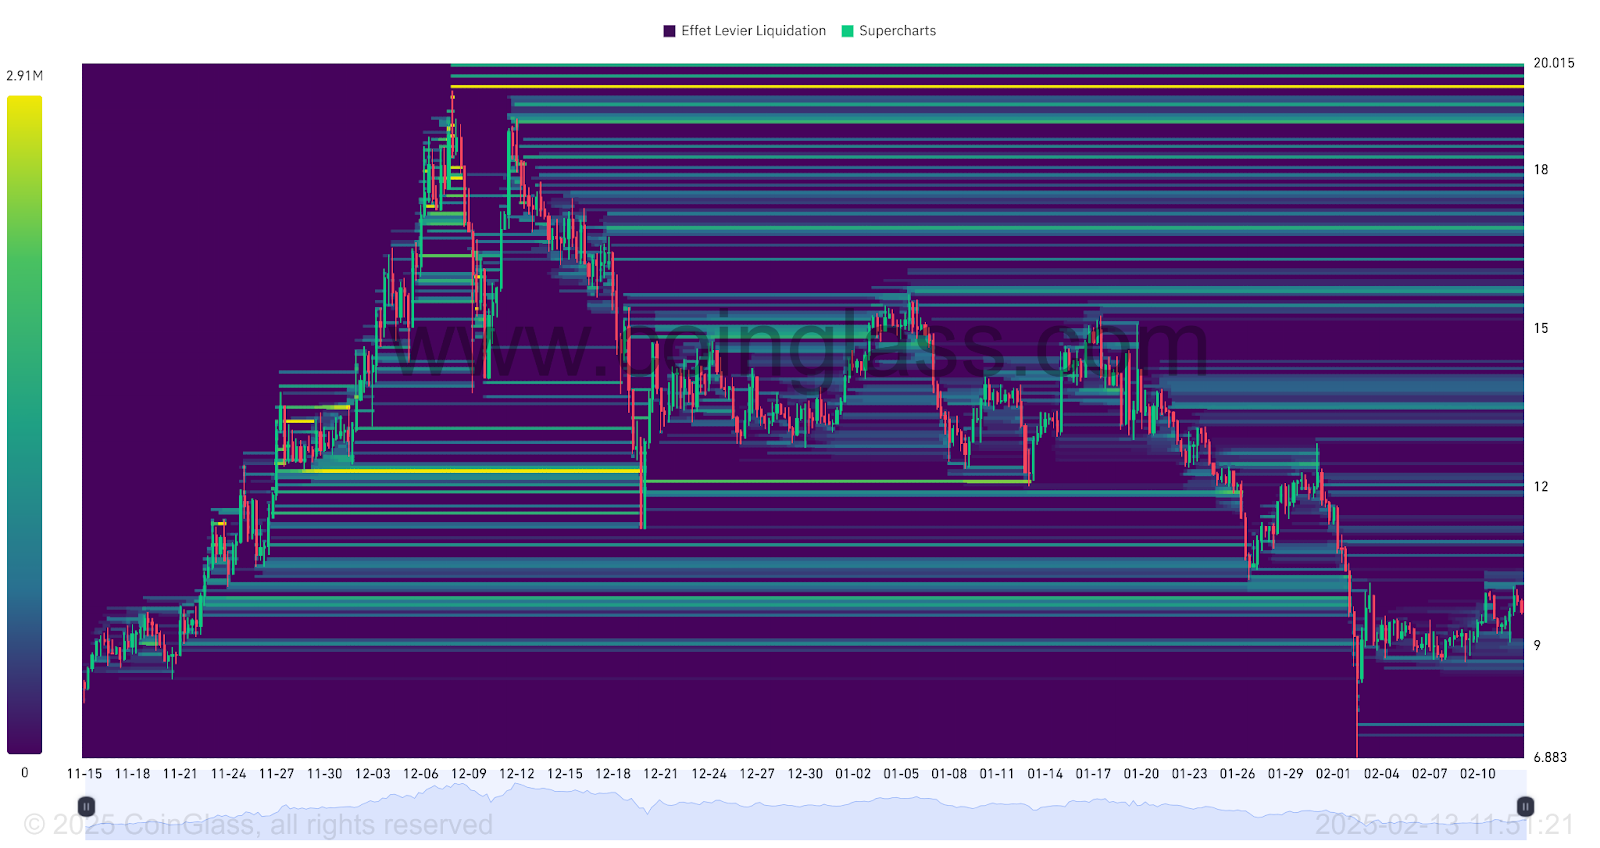
The thermal card of Liquidations of UNI/USDT contracts reveals that the liquidation zone located below 10 $ 10 has been crossed. Thus, this level has obviously not triggered buying orders quite significant to allow the cryptocurrency to truly bounce back.
Now, notable liquidation zones are founds UNI Cours, $ 11 and $ 12, with a higher and high level around $ 13.5, then $ 15.7 and beyond.
Below the current course, you can note key areas at $ 8.6 and $ 7.5.
The price approach to these levels could lead to a massive trigger of orders, thus increasing the risk of increased volatility for the crypto. These areas therefore represent a crucial point of interest for investors.
Forecast for the Uniswap course (UNI)
- If the Uniswap course manages to maintain itself above $ 8.7, an increase in $ 12.5 could be anticipated. The next resistance to monitor, if the Haussier movement continues, would be around $ 15, opening the door to reach its last summit located at $ 19.5. At this stage, this would represent an increase of almost 100 %.
- Conversely, if the Uniswap course fails to maintain itself above $ 8.7, a fall in around $ 7 is possible. In the event of the lowering movement, the next key support could be around $ 6 and $ 5, opening the way to a return to the following supports, located around $ 4. This would then represent a drop of about 60 %.
Conclusion
Uniswap shows signs of recovery after a correction phase, supported by a renewed buyer interest from a key level. However, the medium -term dynamics remain fragile, despite a fundamental trend that is always upward -oriented. Confirmation of a sustainable reversal will depend on the capacity of the market to maintain this impetus. Will the deployment of Unichain strengthen this dynamic? One thing is certain, it will be essential to closely monitor the reaction of prices at strategic levels in order to confirm or adjust current forecasts. Finally, remember that these analyzes are based solely on technical criteria, and that the course of cryptocurrencies can evolve quickly according to other more fundamental factors.
Has this study interested you? Find our latest Solana analysis.
Maximize your Cointribne experience with our 'Read to Earn' program! For each article you read, earn points and access exclusive rewards. Sign up now and start accumulating advantages.