

U.S. stock markets are defying inflation with the S&P 500 continuing its climb toward 5,000, while the DXY teeters at a crossroads. Optimism about stable interest rates, according to the FedWatch tool, mixes with detailed technical analysis of the stock market. Meanwhile, on the crypto front, bitcoin is navigating between bullish and bearish waves, creating a tumultuous dance for careful observers.
American stock market: S&P 500 towards 5,000, DXY at the crossroads
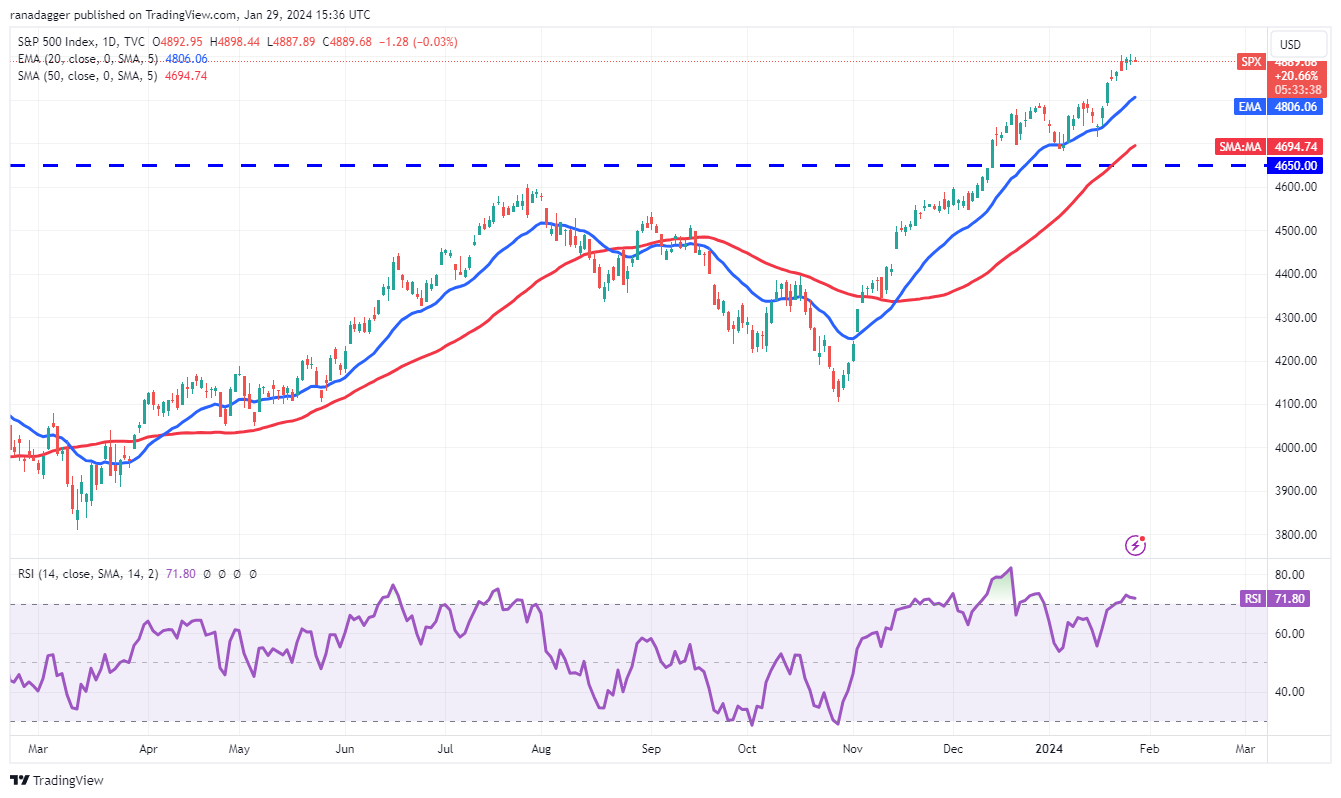
US stock markets persist in their ascent, defying inflation concerns. Despite the uncertainties, the FedWatch tool suggests stable interest rates through March. The S&P 500 Index, up 1.06% last weekis approaching the psychological threshold of 5,000. This increase is encouraged by the prospect of expansionary monetary policies.
On a technical level, analysis of the S&P 500 index reveals resistance at 4,900but a sustained upward trend, precise CoinTurk. Buyers are targeting 5,000, while the break of the moving average at 4,806 could indicate a deeper correction.
On the side of US Dollar Index (DXY), despite resistance at the downtrend line, the bulls are holding the price above the moving averages. The 20-day EMA at 103 and the positive RSI signal bullish momentum. A breakout of resistance would take the index to 104.50 and 106. However, a fall below the moving averages would indicate fierce defense from the bears, threatening a decline to 102. Stock markets continue their dance between optimism and caution, making each movement an anticipation for investors.
Bitcoin in precarious balance
Recent skirmishes on the bitcoin exchange reflect a fierce struggle between bullish and bearish. January 28 and 29, buyers attempted to propel bitcoin past the 50-day moving average, set at $42,795. However, the bears held firm. Current indicators, such as indecisive moving averages and an RSI close to the midpoint, do not give a clear advantage to one of the camps. A breakout above the 50-day moving average could propel the BTC/USDT pair to $44,700 on exchanges, likely provoking a strong reaction from the bears. However, a reversal to $44,700 and a fall below the moving averages could indicate a continuation of the range-bound move.
On the other hand, a decline below the 20-day EMA at $41,950 and holding below this level could result in a gradual descent towards $40,000 and then possibly to $37,980. The next trend move will depend on whether buyers can push the price above $44,700 or whether bears can push the pair below $37,980.
The battle on the bitcoin front continues, leaving observers on alert for the future developments of this crypto battle.
Maximize your Tremplin.io experience with our ‘Read to Earn’ program! For every article you read, earn points and access exclusive rewards. Sign up now and start earning benefits.


