After a strong upward impulse, Solana enters a consolidation phase. Find our complete analysis and the current technical perspectives of the soil.

In short
- Technical analysis: the soil consolidates around $ 170, supported by an upward dynamic on all horizons, increased volumes and a momentum in recovery.
- Technical levels: The course oscillates between major levels, with a neutral bias to watch around $ 133. A break in extremes could lead to a strong directional movement.
- Derivative market: Open Interest is slightly back. The selling pressure remains moderate, and the global feeling remains upward -oriented, without excess.
- Forecasts: The scenario remains bullish above $ 159, with targets at $ 184, $ 209 and $ 220 (+31 %). In the event of a downward break, a decline in $ 101 (-39 %) is possible. The whole will depend on the macroeconomic and geopolitical context.
Solana technical analysis (soil)
| Indicator | State | Comment |
| Spot price | ≈ $ 170 | The price stabilizes around $ 170, in an intermediate zone after a strong rebound. |
| Latest weekly variations | ≈ + 0.05% | Sol marks a technical break after an important bull movement. |
| Latest weekly spot volumes | ≈10.15 B (+16 %) | Notable increase, translating a renewed interest from investors. |
| Long -term trend (SMA 200) | Upward | The substantive dynamics are upward, with a clear recovery after correction. |
| Medium -term trend (SMA 50) | Upward | The trend remains well oriented, marked by a series of coherent bullish movements. |
| Short -term trend (SMA 20) | Upward | The price evolves in a constructive way, carried by a dynamic of sustained recovery. |
| Momentum | Bounce | Recovery of the momentum, with an upward dynamic which is gradually installed. |
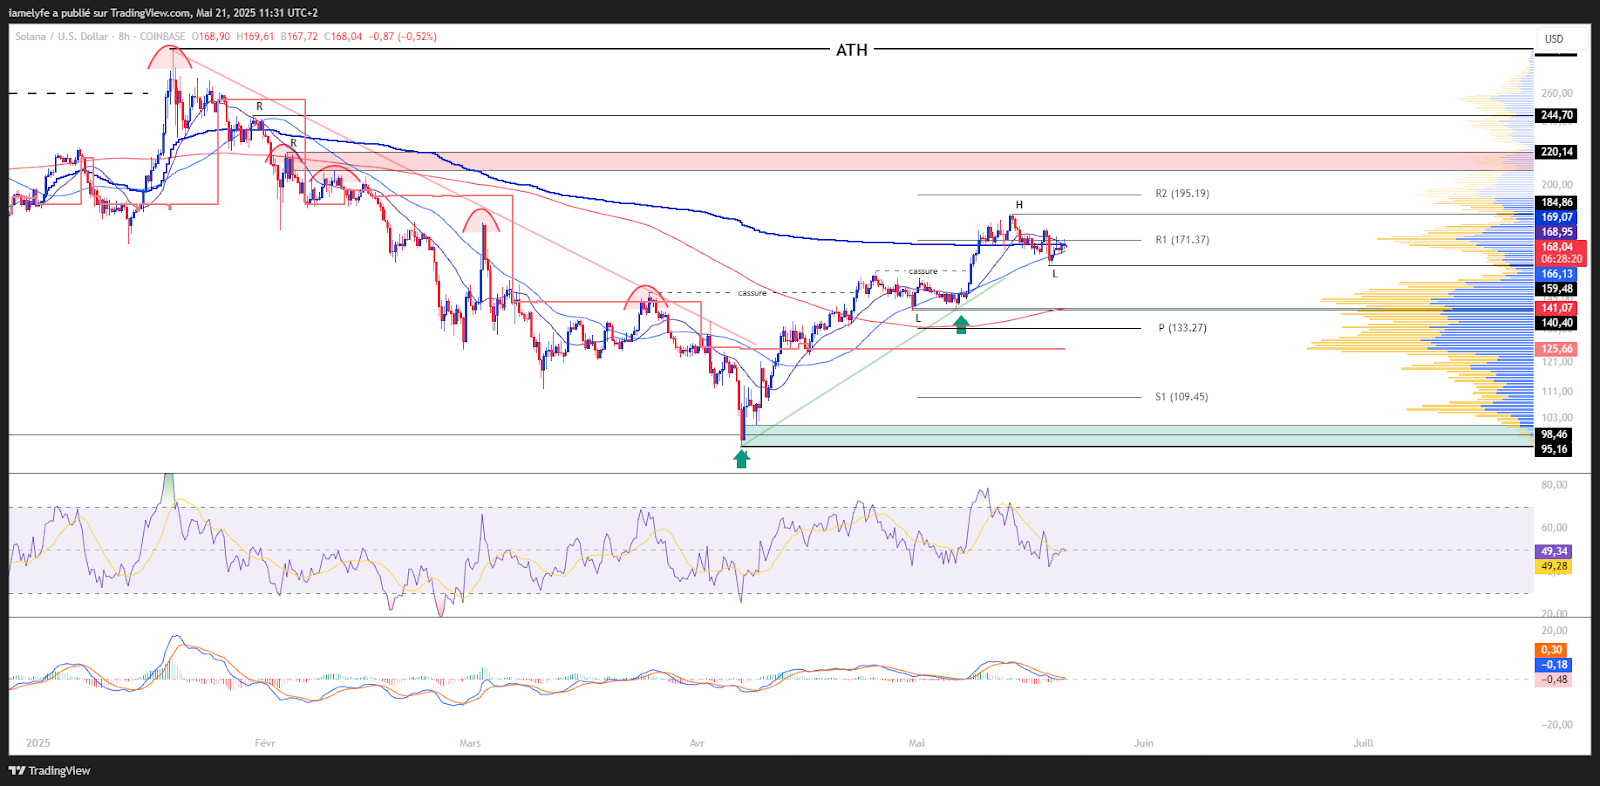
Solana consolidates around $ 170 after a strong upward impulse. The almost stable weekly variation (+0.05 %) reflects a breathing phase on the market. Spot volumes up 16 % (≈10.15 b), however, confirm a renewed interest in investors. The dynamics remain upward on the short, medium and long term, maintaining a constructive technical structure. The momentum is recovered, supporting the continuation of the recovery.
Solana technical levels (soil)
| Indicator | State | Comment |
| Resistances | $ 184 / $ 220 / $ 243 | Potential distribution zones; Their overtaking would open the way to an upward extension. |
| Supports | $ 140 / $ 123 / $ 108 | Historical demand zones; Their break would expose a risk of downward prosecution. |
| Monthly pivot | $ 133 | Reference level for the trend of the month. |
| High value area | $ 237 | High volume area; Upper terminal of a market balance, beyond which an imbalance can emerge. |
| Low value area | $ 143 | High volume area; Low limit of a market balance, beyond which an imbalance can emerge. |
Solana evolves between key technical levels. Resistors located at $ 184, $ 220 and $ 243 are potential distribution areas, the crossing of which could promote an upward extension. Conversely, supports at $ 140, $ 123 and $ 108 correspond to historical demand zones; Their break would expose the market to pursuing the decline. The monthly pivot point at $ 133 serves as a landmark to assess the bottom bias. Finally, the high value area at $ 237 and the low value area at $ 143 delimit a market balance; Overcoming these terminals could lead to a directional imbalance.
Current technical analysis was carried out in collaboration with ElyfeAnd 0xhugzerinvestors and popularizers in the cryptocurrency market.
Derivative analysis (soil/USDT)
| Indicator | State | Comment |
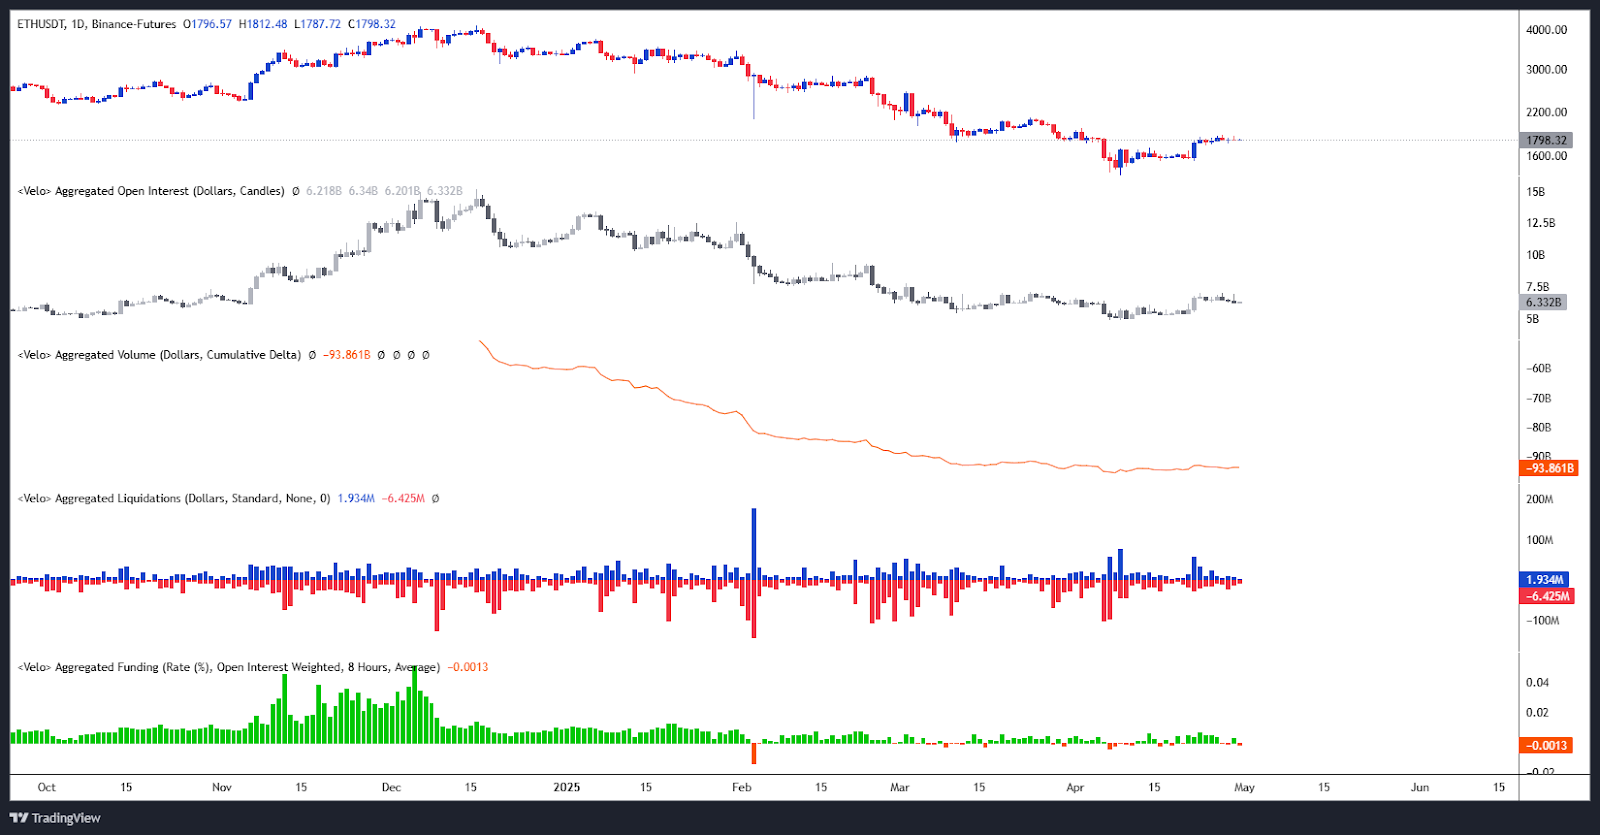
| Open Interest | Drop | Folding positions, signal of disengagement or profits. |
| CVD | Dominance seller | CVD declining, reporting a sales pressure on the market. |
| Liquidation | Weak, without bias | Limited liquidation activity, absence of directional pressure. |
| Funding Rate | slightly positive | Light bias bias, moderate bonus for long positions. |
Market data suggest a climate of wait -and -see. Open Interest is decreasing, indicating a withdrawal of positions and possible disengagement. The CVD shows a selling dominance, reflecting pressure on the market oriented for sale. The liquidation activity remains low, without sign of forced clearance or marked directional bias. Finally, the positive funding rate testifies to a moderate advantage, without excess of bullish feeling.
| Indicator | State | Comment |
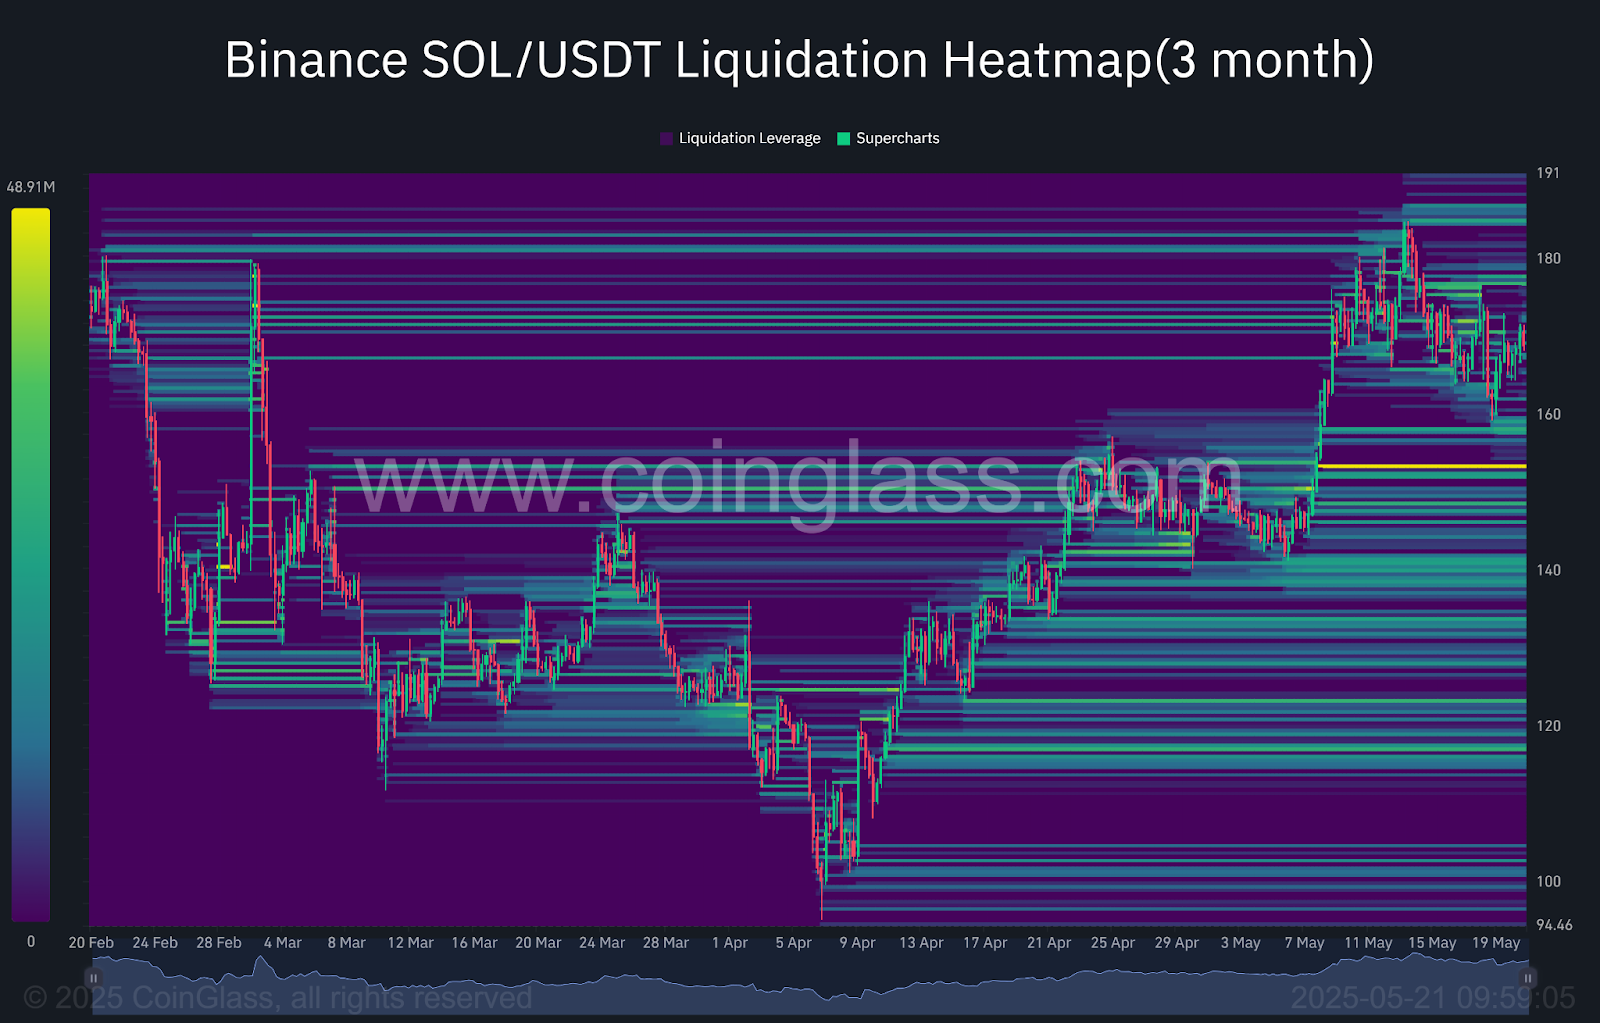
| Selling liquidation zone | ≈ $ 176 – $ 182 / $ 185 / $ 187 / | Order concentration area; The achievement of these levels could result in an acceleration of volatility. |
| Buyer liquidation area | ≈ $ 160 – $ 156 / $ 153.5 – $ 151 / $ 150 – $ 146 / $ 141 – $ 136 | Order concentration area; The achievement of these levels could result in an acceleration of volatility. |
Selling liquidation zones are located at $ 176 $ 182, $ 185 and $ 187, and buying liquidation zones at $ 160 $ 1,156, $ 153.5 $ 151, $ 150 $ $ 146 and $ 141 $ 1. These areas concentrate orders and their crossing could result in acceleration of volatility, with more marked pressure on the buyer side given the greatest number of identified levels.
Forecasts for Solana's Cours (soil)
Haussier scenario:
- Objectives: $ 157 / $ 184 / $ 209 – $ 220 and more.
- Potential: approximately +31 % since the current level.
Lower scenario:
- Conditions: breakdown of the support at $ 159.
- Objectives: $ 140 / $ 123 / $ 108 – $ 101.
- Potential: decreased up to -39 % since the current level.
Comment :
The bias remains bullied, but the American macroeconomic indicators as well as the news related to the global geopolitical context will be decisive to confirm this scenario.
Conclusion
Solana consolidates after a strong upward impulse, in an always favorable technical context. The trend remains well oriented, with a renewed interest in investors. The market is evolving between key levels, whose rupture could trigger a directional movement. On the derivative side, prudence dominates: withdrawal of positions, moderate selling pressure, but without excessive tension. The feeling remains slightly positive, in an environment depending on the macroeconomic and geopolitical context. In this context, it will be essential to closely monitor the reaction of prices at strategic levels in order to confirm or adjust current forecasts.
Finally, remember that these analyzes are based solely on technical criteria, and that the course of cryptocurrencies can evolve quickly according to other more fundamental factors.
Has this study interested you? Find our latest SU analysis.
Maximize your Cointribne experience with our 'Read to Earn' program! For each article you read, earn points and access exclusive rewards. Sign up now and start accumulating advantages.