

After crossing its highest historic level, Solana faces a downward pressure threatening its course. Discover Elyfe's analysis to decipher the technical perspectives of the soil.

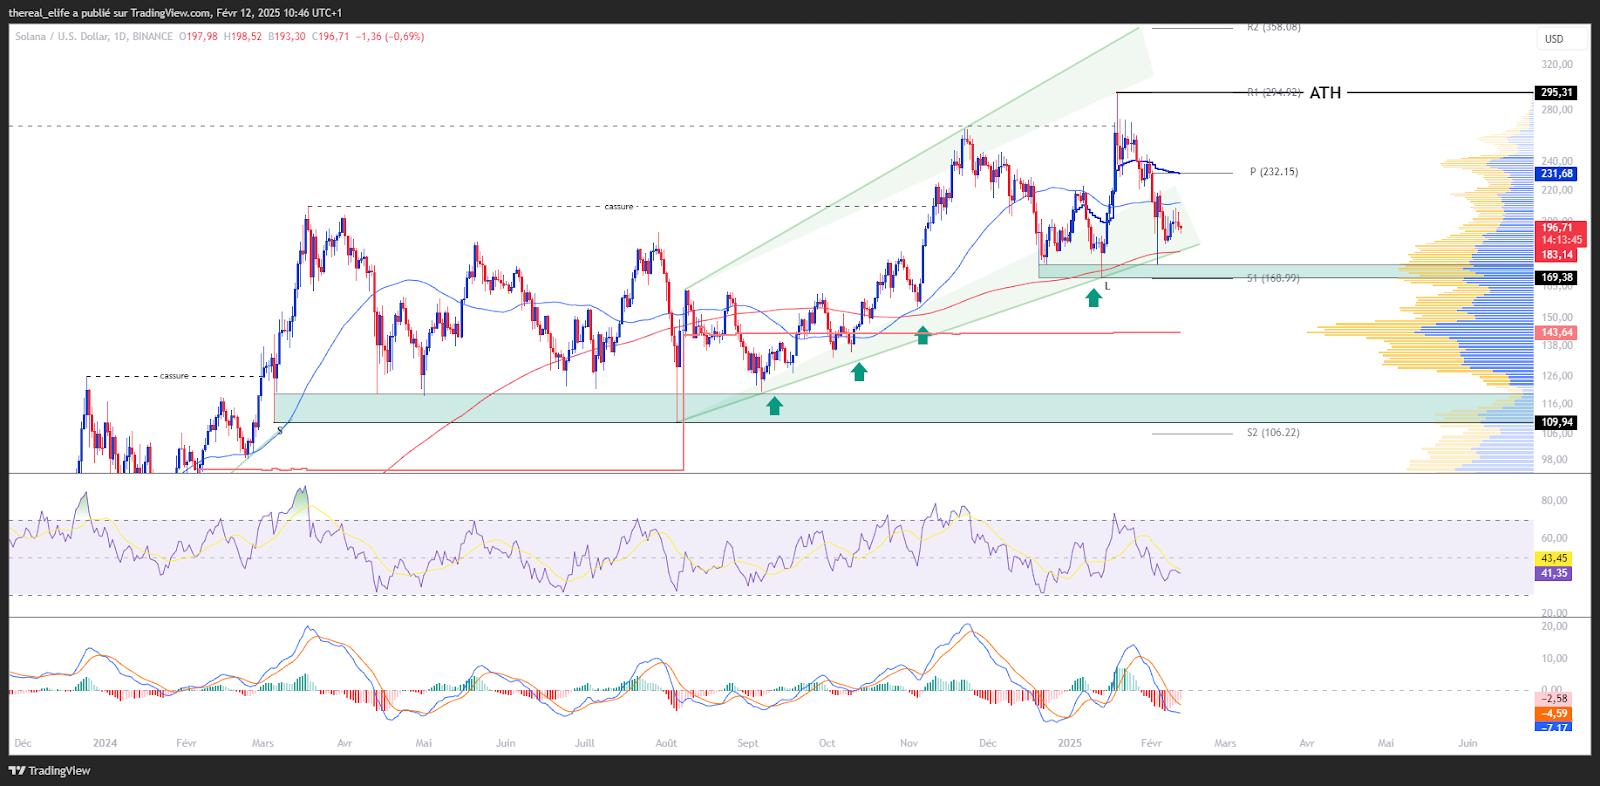
Situation of the Solana (soil)
After crossing the resistance of $ 210, Solana continued her rise towards her last ATH identified at $ 267. Upon reaching this level, the ground price was dropped, bringing it to $ 170, thus recording a correction of more than 36 %.
Fortunately, this price level, supported by the 200 -day mobile average and the first pivot support, triggered a buyer interest that was maintained. This then made it possible to cross its previous summit and record a new higher historical at $ 295.
Unfortunately, the ground rise was not supported, in part due to the overall decrease in the crypto market. He recently found his support around $ 170.
At the time of the editorial staff, the Solana lesson is negotiated around $ 196. It evolves above a significant value area, as well as its 200-day mobile average.
However, Solana is now under its annual VWAP, which coincides with its monthly pivot point at $ 232. Although the short -term trend remains down, the medium and long -term dynamics remain upwards.
This upward structure is confirmed by the positioning of mobile averages 50 and 200 dayswhich remain crossed and upwards, signaling the maintenance of the substantive trend despite the current consolidation.
On the side of the upward dynamics of the ground, it is not surprising that it was revised downwards, which is reflected both in its price and in its oscillators.
Current technical analysis was carried out in collaboration with Elyfeinvestor and popularizer in the cryptocurrency market.
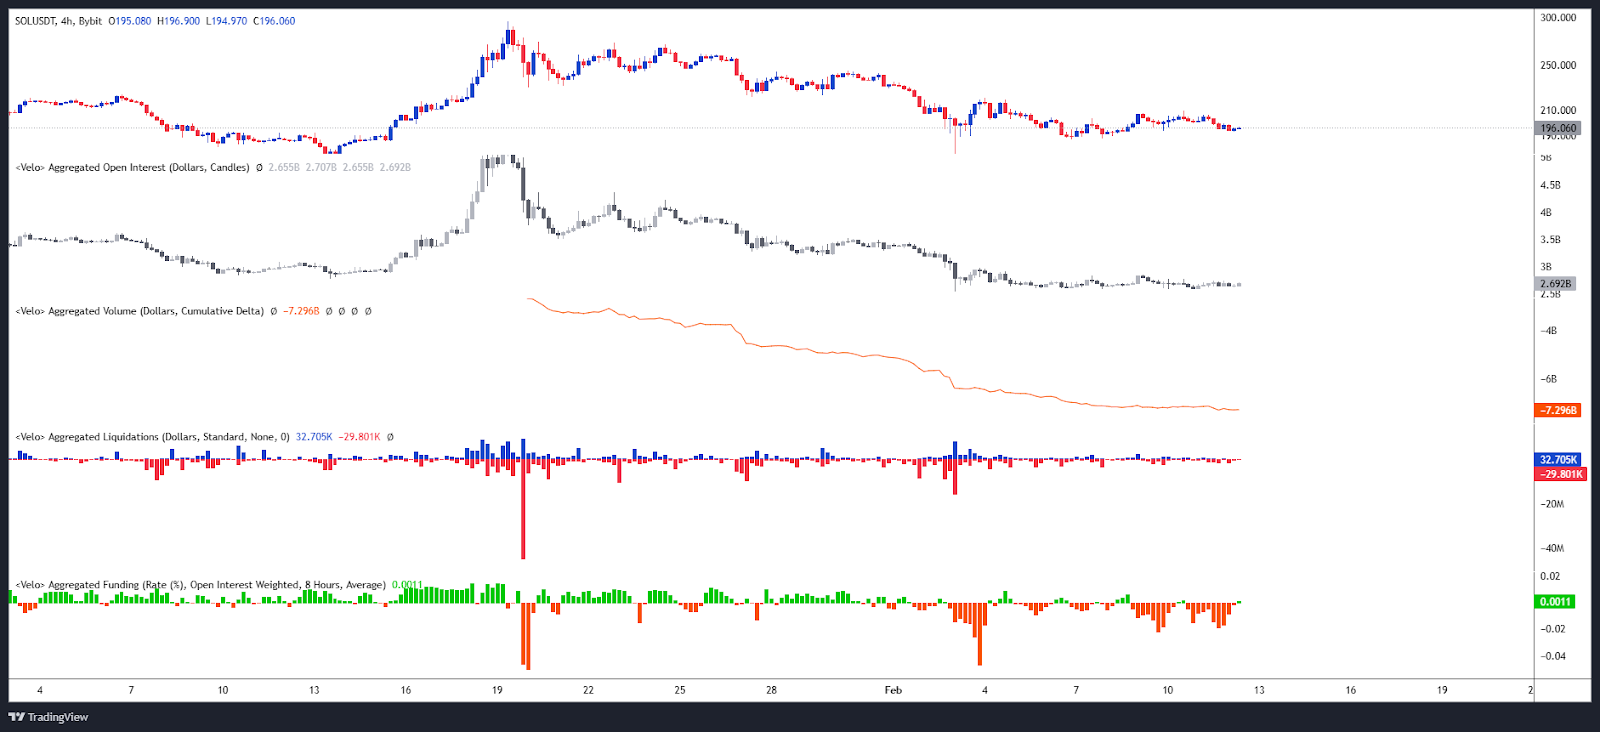
Zoom on Solana derivatives (Solusdt)
Although the open interest of perpetual soil/USDT contracts seems to stabilize, it was revised downwards, depending on the trend of the course of its underlying. This testifies to a decreasing interest as Solana's price decreases.
On the CVD side, it is also down, indicating a predominance of market sales orders, thus contributing to increased sales pressure.
The financing rate has passed in negative territory, reflecting lowering convictions.
Finally, since the peak of liquidation of long positions of February 3, liquidations have remained limited on both sides of the market after the last bitcoin correction, without significant movement for buyers or for sellers. This situation testifies to a stable market, controlled volatility and prudent risk management, reflecting a certain balance.
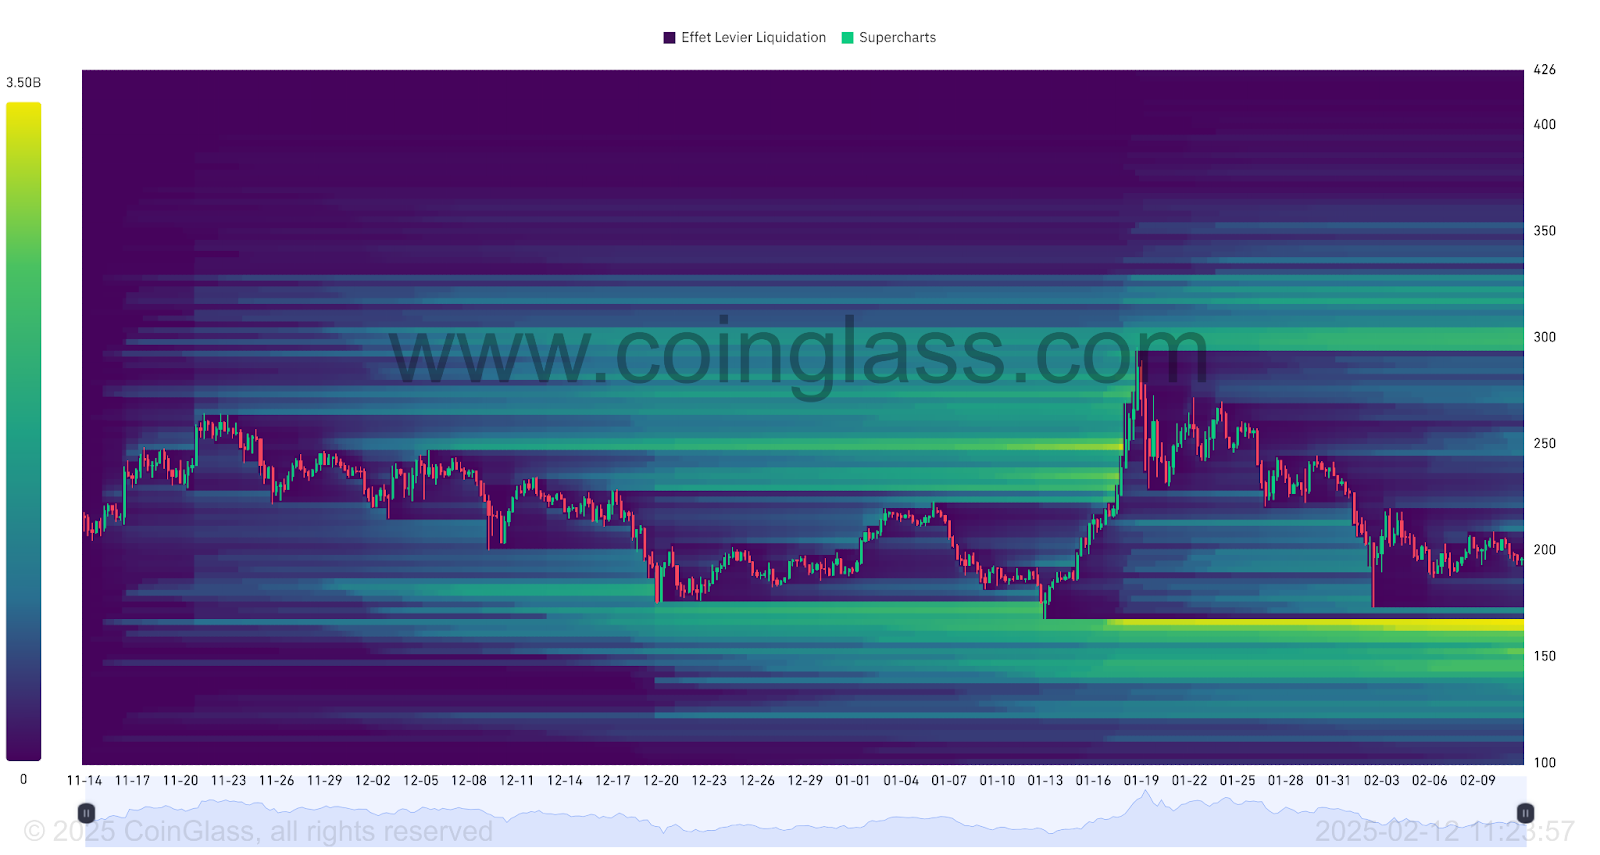
The thermal card of liquidations of the Sol/USDT contracts reveals that the liquidation zone located below 300 $ aroused selling orders due to the drop in the course. Although this area remains visible, the most significant liquidation zone is below the current Solana course, around $ 160.
The price approach to these levels could lead to a massive trigger of orders, thus increasing the risk of increased volatility for the crypto. These areas therefore represent a crucial point of interest for investors.
Forecast for Solana's Cours (soil)
- If the Solana course is maintained above $ 170, you could anticipate a return to $ 220-$ 240. The next resistance to monitor, if the Haussier movement continues, is around $ 270, or even a return to the last ATH at $ 295. At this stage, this would represent an increase of more than 50 %.
- Conversely, if the Solana course fails to maintain itself above $ 170, a decline around $ 155 is possible. The next support to consider, in the event of continuation of the lower movement, could be between $ 140 and $ 130, or even around a medium and long term support level close to $ 110. This would then represent a drop of around 43 %.
Conclusion
Solana shows notable resilience despite a correction phase, supported by key levels that have favored a rebound. Although the short -term trend remains uncertain, the background dynamics remain positive, indicating a medium and long -term recovery potential. In this context, it will be essential to closely monitor the reaction of prices at strategic levels in order to confirm or adjust current forecasts. Finally, remember that these analyzes are based solely on technical criteria, and that the course of cryptocurrencies can evolve quickly according to other more fundamental factors.
Has this study interested you? Find our latest Ethereum analysis.
Maximize your Cointribne experience with our 'Read to Earn' program! For each article you read, earn points and access exclusive rewards. Sign up now and start accumulating advantages.


