
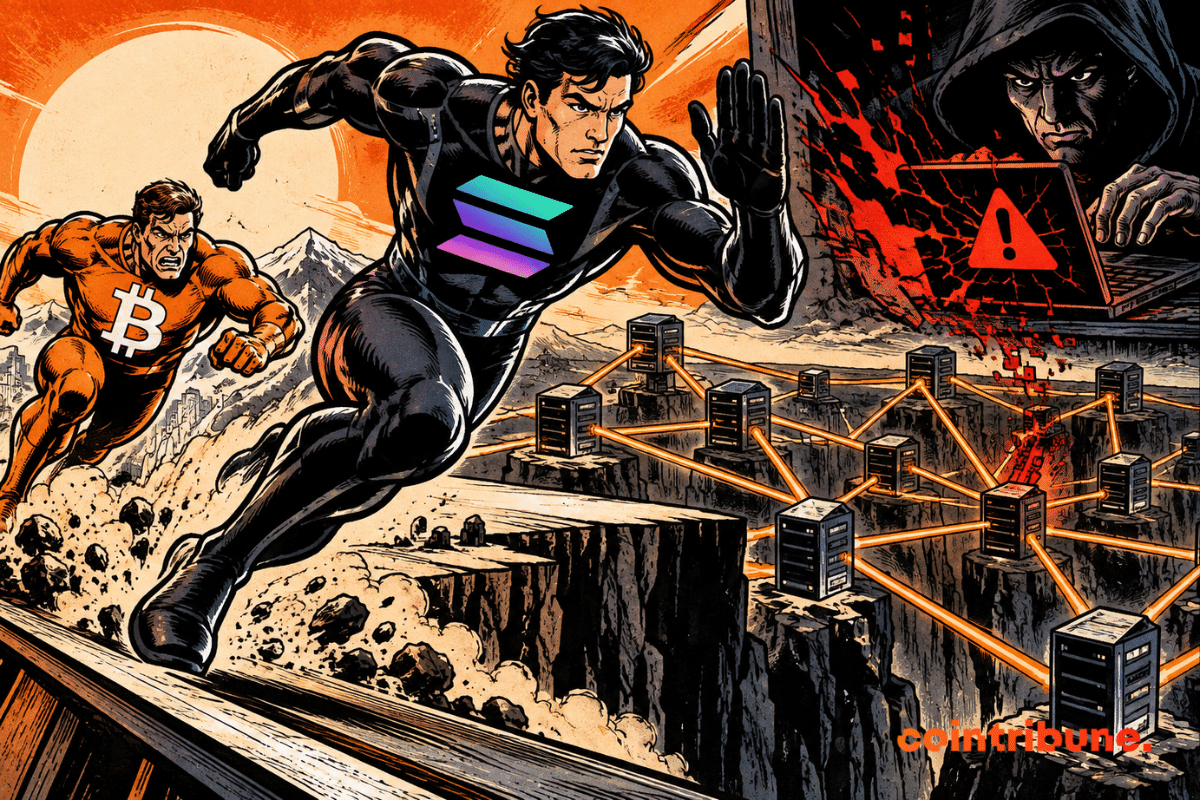
Decentralization is returning to the center of debates on blockchains used as settlement infrastructures. The new dashboard published by ARK Invest and Glassnode compares several forms of risk exposure. It places Bitcoin at the top of the composite ranking, while assigning a higher resilience threshold to Solana. This difference also shows that decentralization does not depend only on consensus. Pools, validators, hosts, software and exit mechanisms also modify the observed level of risk.
In brief
- Bitcoin retains the top spot in ARK Invest and Glassnode’s composite decentralization rankings.
- The critical resilience threshold reaches 3 entities for Bitcoin and Ethereum, compared to 19 for Solana.
- The three main Bitcoin mining pools concentrated 59.04% of the blocks observed as of September 6.
- Solana has a high concentration of stakes around Agave/Jito, with around 92% of stakes according to the cited data.
- The diversity of software, validators and infrastructures remains essential to limit the risks linked to a bug or a common dependency.
Bitcoin maintains first place in the global ranking
ARK Invest and Glassnode are introducing a metric called the Critical Resilience Threshold. It indicates how many major entities must coordinate their actions to cross an important concentration point. The dashboard published on September 1 sets this threshold at three entities for Bitcoin and Ethereum. For Solana, the figure reaches 19 entities. Yet Bitcoin tops the composite decentralization rankings.
The authors distinguish in the report the risk of capturing the consensus of other forms of dependence. Ownership, infrastructure, software, auditability and speed of release can also create pressure points. They must define the level of failure that their activity can withstand. For Bitcoin, the analysis relies on the hashing power assigned to mining pools.
A seven-day snapshot of Bitcoin miningdated September 6, gives 26.88% of the blocks to Foundry USA. AntPool represents 16.91% and F2Pool 15.25%. Together, these three pools reach 59.04% of the observed production. This concentration corresponds to the threshold of three entities presented in the report. The data thus shows why pools occupy a central place in this measure.
However, a miner’s share in a pool does not correspond to their ownership. Each miner contributes its computing power to a coordinator and can change destination. The report estimates that a miner with 1% of a pool can exit that position in around 30 seconds. All he has to do is turn off his equipment to interrupt this contribution. However, control of the machines remains more dispersed.
Solana shows a higher capture threshold
Solana’s case relies on the distribution of stakes to measure its exposure. The ARK Invest and Glassnode dashboard sets the critical resilience threshold at 19 entities. Solana Compass displayed a Nakamoto coefficient of 18 on September 6. The Solana Foundation had indicated a value of 20 in its health report of June 2025, based on data from April.
These differences above all show the importance of the method used. Compass defines its coefficient as the minimum number of validators needed to reach 33.4% of voting power. According to the Foundation, this coalition can censor blocs or stop consensus. A value of 18 therefore requires the coordination of many major validators. The figure of 19 obtained by ARK and Glassnode is based on their own analysis framework.
The classification of entities also complicates comparisons. On staking-based networks, the relevant entity may be a liquid staking protocol, an exchange, a distributed network of validators, an operator or an individual validator. The same structure can therefore represent a single label or several independent operators. The chosen grouping then changes the concentration reading.
Ethereum illustrates this difficulty with Rated Network data. On September 6, Lido accounted for 21.17%, SSV 16.56%, and Binance 7.77% in the pool overview. The same table presented Lido as 544 entities. The threshold is therefore not sufficient to describe the entire structure of a network. Stakeholders should also consider how data groups operators together.
Infrastructure dependencies change risk
Concentration does not only concern block producers or validators. A data center, cloud provider, network operator, or government can affect multiple nodes simultaneously. The risk then depends on several technical layers. A blockchain can have a wide distribution of consensus while maintaining common dependencies on its infrastructure.
Bitcoin node data illustrates this difficulty. The joint report indicates that 63% of nodes operate via Tor. Clark Moody’s Dashboard had 12,959 Tor nodes among 26,837 accessible nodes on September 6. This measurement represents 48.3% of this observed population. The collection methods and populations studied explain part of this discrepancy.
The use of Tor nevertheless provides information on the visibility of nodes and their geographic resilience. To evaluate the infrastructure, the nodes and their connection modes provide another reading. On the network, the search for high capacity pushes some validators towards commercial data centers. The Solana Foundation report listed more than 100 suppliers. TeraSwitch and Latitude together held 45.70% of the measured shares.
Solana Compass currently lists 437 data centers, despite a significant concentration of shares among certain providers. This situation shows that the number of infrastructures is not enough to measure their real distribution. Supplier diversity can coexist with high share concentration. The analysis must therefore look at both the number of actors and their respective weight.
Software becomes another point of focus
The diversity of software constitutes another central element in the risk assessment. Ethereum recommends multiple independent implementations to limit the impact of a shared bug. Rated indicated that Geth represented 50.17% of measured execution clients. Software concentration can therefore produce a different failure mode than voluntary collusion.
The Foundation indicated in April 2025 that approximately 92% of stakes used Agave/Jito. Firedancer or the hybrid Frankendancer accounted for around 7% of stakes. This distribution shows a strong exposure to a common software environment. It also gives particular importance to the diversity of customers when a technical problem arises.
However, the information provided does not describe any specific incident or its operational effects. They show why a software bug can become a subject of resilience when many validators depend on the same implementation. A problem affecting a widely deployed base might have a different scope than an error limited to a few operators. We must therefore distinguish the technical incident from the concentration it reveals.
The comparison with Ethereum reinforces this reading. Geth reaches 50.17% of measured execution clients, while Agave/Jito concentrates around 92% of stakes on Solana according to the cited data. These numbers do not measure exactly the same thing. However, they point out the same principle: several economic entities can depend on the same software environment.
Exit velocity completes the resilience measure
Finally, the ability to quickly leave a concentrated structure constitutes a determining factor. Bitcoin miners can redirect their work without waiting for a protocol queue. Ethereum validators follow an output process whose pace varies depending on demand. ARK Invest and Glassnode estimate that situations of high tension can prolong this exit for several weeks. The actual delay therefore depends on the level of pressure exerted on the network.
The data from September 6, however, shows a different situation at this time. Beaconcha.in displayed an empty validator output queue. The site then estimated the withdrawal at around one day. Ethereum documentation specifies that this delay varies depending on demand. Actors must therefore integrate this exit capacity into their risk assessment.
The distinction between liquidity and protocol exit also remains important. A liquid staking token can circulate in the market without immediately causing the underlying validator to exit. Conversely, native output depends on the rules and the protocol’s ability to process requests. The two mechanisms therefore offer different routes to reducing concentrated influence.
Ultimately, the table from ARK Invest and Glassnode places Bitcoin at the top of its composite indicator. Solana, however, obtains a significantly higher critical resilience threshold, with 19 entities compared to three for Bitcoin. The software bug must also be placed in this grid, because the diversity of customers influences the potential extent of a technical failure. The comparison is thus based on several layers rather than on a single indicator.
What happens next will therefore depend less on an isolated figure than on the capacity of the networks to limit common dependencies. For Bitcoin as for Solana, pools, validators, hosts and software will remain separate indicators. Decentralization will thus be measured across all of these layers, rather than using a single indicator. Their monitoring will make it possible to better assess resilience in the face of incidents or changes in concentration.
Maximize your Tremplin.io experience with our ‘Read to Earn’ program! For every article you read, earn points and access exclusive rewards. Sign up now and start earning benefits.


