THE bull market of 2024 is already well advanced, while many indicators show a sudden weakening of the bullish force since March 2024. We had to wait 1 year and 4 months to return to the last historic highs, that is to say approximately half of the dominant bitcoin cycle. At the same time, the halving (over anticipated) did not move the price of bitcoin. While the trend remains bullish with a consensus target at $100,000, has bitcoin exhausted its upside potential faster than normal?
A promising year 2024 so far
In August 2023, we talked about the high probability of a bull market. Several indicators thus showed a strong probability in favor of the hypothesis of a bull market in 2024:
- On the one hand, the cyclicality of the market. Indeed, bitcoin reacts according to dominant cycles of 3.6 years. This cycle suggested that the November 2022 low point was a major low point. A bull market would then be triggered 1 to 1.5 years later.
- On the other hand, specific indicators like fractals indicated clear upside potential.
- Finally, the good timing of Halving also suggested a psychological framework favorable to this bull market.
| Cycle No. | Hollow | Summit | Trough to Trough Duration | Trough-to-peak performance |
| 1 | November 2011* | December 2013 | — | +968% |
| 2 | January 2015 | December 2017 | 3.1 years | +8,328% |
| 3 | December 2018 | November 2021 | 3.9 years | +1,961% |
| 4 | November 2022 | — | 3.9 years | — |
| AVERAGE | November | December | 3.6 years | +3,752% |
In any cyclical theory, bitcoin would thus be favorably exposed until early 2025/mid-2025. Thus, since January 1, 2024, the price of bitcoin has increased by more than 50%. The trend therefore remains structurally upward.
The magnitude of the 2024 bull market
In August 2023, we judged that the upside potential towards previous peaks was very high. Therefore, the price target at $69,000 seemed to be the first legitimate target in this bullish scenario. This goal was reached and exceeded in March 2024 at almost $74,000. The challenge now is to judge the possibility of continuation of this bull market.
“ Obviously, a return to previous highs ($69,000) would be the first desirable objective, followed by extensions. We know that the value of bitcoin essentially depends on the long-term use of the cryptocurrency. […] Thus, the potential for a hypothetical bull market from 2024 would be based on the ability of central banks to relax their policythe ability of stock market indices to perform sufficiently by 2025, and mechanically, the ability of the economy to remain resilient (no recession). Otherwise, it would likely set back the stated scenario. […] Therefore, it appears that the return of bullish forces could be gradual in the coming months. The current stagnation of bitcoin could be explained by a theoretical opposition between the 3.5-year trends and the 1.8-year trends. »
Cryptocurrencies: a bull market in 2024? – Tremplin.io
Is the market abnormally exhausted?
To better understand the importance of temporality in this bull market in 2024, we compared the different historical cycles. The current price of bitcoin since November 2022 is given by the red curve. We clearly see that the bull market observed since the end of 2022 is part of the historical “norm” of the dominant bitcoin cycle. Indeed, up to 2 years after the last major low point, bitcoin seems to follow a fairly reliable trajectory.

Furthermore, there is a clear symmetry between historical developments and the current evolution of the price of bitcoin. The rise in the price of bitcoin since the start of 2024 would even tend to slightly exceed its historical norm. Consequently, the immediate conclusion would be that the consolidation movement observed since March 2024 would not be abnormal, on the contrary. The converse would even be that the historical scenario being respected, we could witness a second bullish phase in the summer of 2024.
Finally, we will notice that the trajectory of the price of bitcoin (BTC) becomes less “normalized” from the 25th or 30th month of the cycle. In other words, volatility increases because agents' behavior is more euphoric. It will therefore be theoretically more difficult to make projections in 2025 or 2026 on the price of bitcoin than in 2024.
What would be the objective of the historical norm?
The last two bull markets have multiplied the price of bitcoin between 10 and 100 times. It would therefore be legitimate for an investor to assume a bitcoin price multiplied by 10 since November 2022. This would equate to a final target near $150,000 to $160,000, which also corresponds to the Fibonacci extension at 2.618. However, we will also notice that the increase in the capitalization of bitcoin in the long term mechanically reduces the upward performance from one cycle to the next. This objective would therefore be less well-founded than the previous ones. Conversely, this encourages us to monitor bearish indicators on bitcoin more closely in 2024 and 2025.
A look at fractals
Fractals are quite reliable on the price of bitcoin (BTC). In particular, the Hurst coefficient (read more) makes it possible to measure the degree of persistence of a trend from one time scale to another. The Hurst coefficient is ideally bounded between 0 and 1. In the case of bitcoin, a Hurst coefficient close to 1 indicates significant upside potential, and therefore good symmetry with major lows. Conversely, a Hurst coefficient close to 0 will indicate that the trend is anti-persistent and is likely to turn downward.

In January 2023, the fractals showed a clear buying signal. The increase in 2023 was also accompanied by strong upward potential. However, the rise in the price of bitcoin (BTC) in 2024 was accompanied by a rapid reduction in the Hurst coefficient. In March 2024, the coefficient even reached the critical threshold of 0.3 (which is quite bearish…). This situation is in every way similar to that of February / March 2021. Despite everything, the correction of March and April 2024 was accompanied by an increase in the Hurst coefficient.
The upward potential is therefore still present, but significantly weakened in terms of fractals. The market, as it were, is now on pivotal points rather than an established bottom. Without further increases in the Hurst coefficient, the market's bullish strength in 2024 could be significantly reduced.
A look at Technical Analysis
The technical construction of the bull market in the price of bitcoin (BTC) is quite clear. Indeed, a major upward trend has been taking shape since January 2023. This trend was perfectly structured by a flag at the start of 2024, whose theoretical target was close to $73,000. Now, since March 2024, we have observed the formation of a wedge/pennant. The extended target of this figure, now broken in mid-May 2024 by a bullish engulfing, would be at almost $100,000. Which also corresponds to the Fibonacci extension at 1.618. This objective would be clearly confirmed by the break of $67,250 then $73,800.
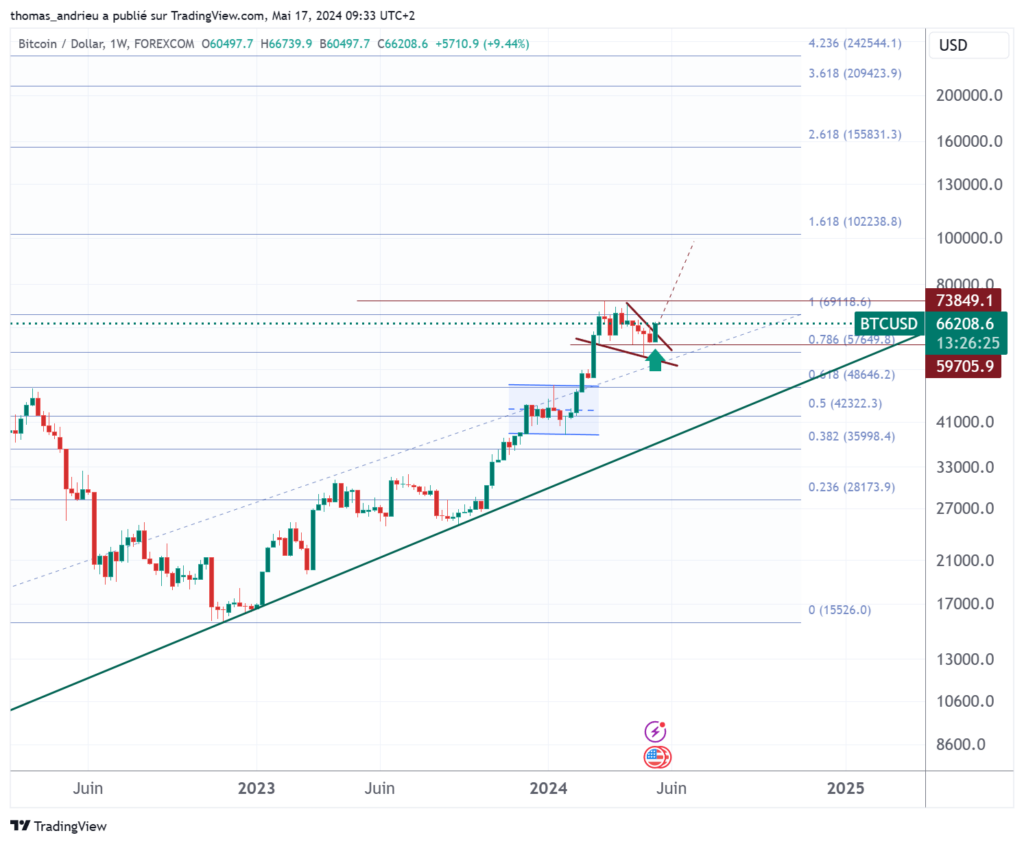
Consequently, the long-term trend remains bullish. The evolution of the price of bitcoin (BTC) in recent weeks shows the encouraging break of a technical consolidation figure.
In conclusion
As expected, the bull market in bitcoin is clearly advanced. The dominant bitcoin cycle still seems to act with such precision and accuracy that the temporality of the market is still perfectly respected. If the long-term trend remains bullish, the stagnation of bitcoin around the previous highs of 2021 calls for more caution. Note again the symmetry of the current bull market with previous bull markets.
In addition, the consolidation observed since March 2024 has confirmed a clear weakening of the bullish force compared to 2023. The fractals thus show that the bull market has clearly lost its potential during this latest correction. Attention to bearish signals should ideally be reinforced. Nevertheless, it is clear that monetary and economic factors remain favorably oriented. A major and upcoming technical objective would therefore be that of $100,000. In the event of bitcoin's behavior being similar to previous bull markets, it would not be impossible to envisage $150,000, but this objective would require greater bullish force which is currently absent.
Maximize your Tremplin.io experience with our 'Read to Earn' program! For every article you read, earn points and access exclusive rewards. Sign up now and start earning benefits.
Click here to join 'Read to Earn' and turn your passion for crypto into rewards!