The Ethereum cryptocurrency is rebounding after falling slightly at the start of the week. Let’s see the future prospects for ETH.
Status of Ethereum (ETH)
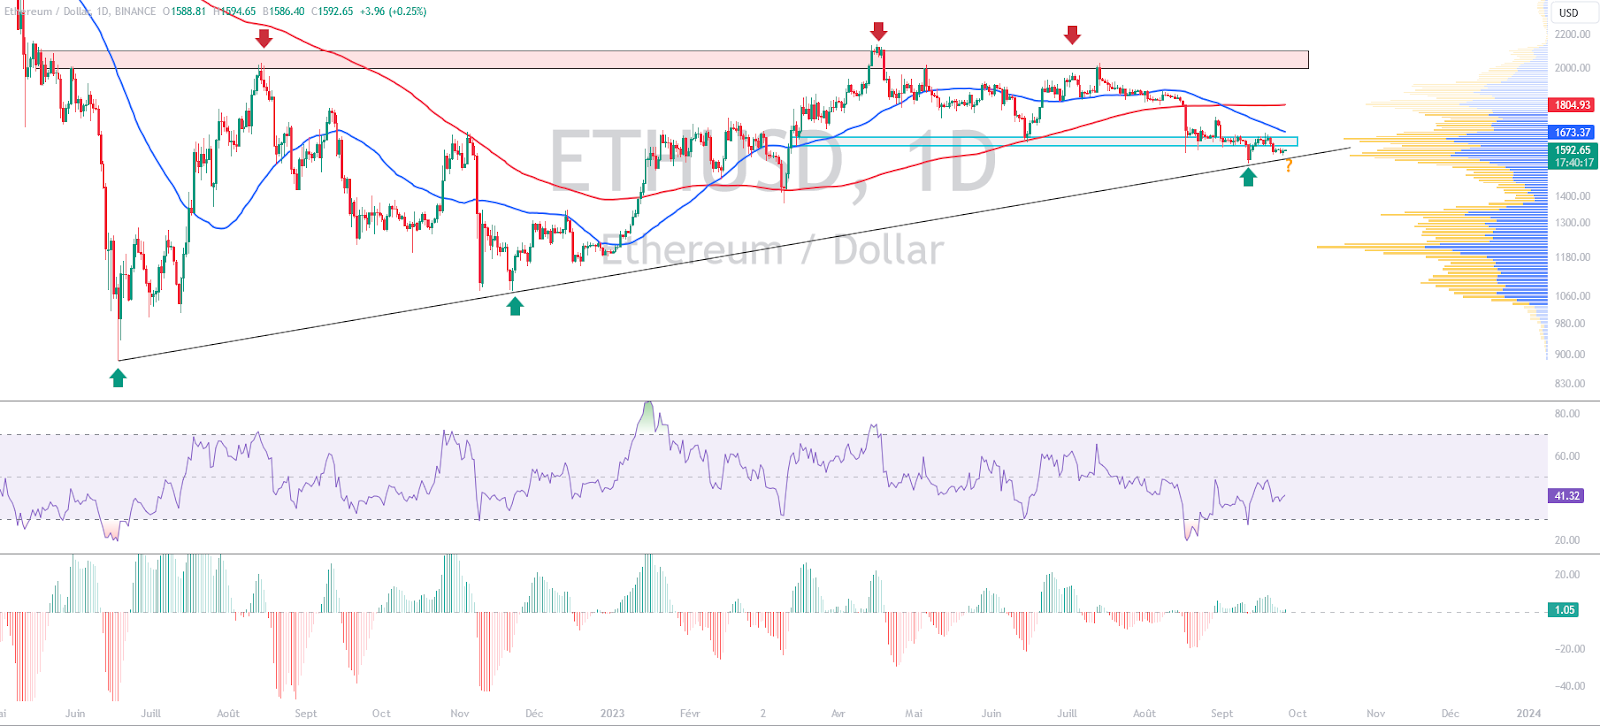
Last week, the ETH price rejected the $1,650 zone. We highlighted the relevance of this level in the analysis of September 13. Unfortunately, Ethereum failed to break through this level, which dragged it below. The cryptocurrency is now trading just below $1,600. The ETH price has moved away from the 50-day moving average which is clearly heading south. This demonstrates the direction of the short-term trend that Ethereum has taken. However, it is interesting to see that the ETH price meets the bullish trendline drawn from the last low points since the cryptocurrency’s all-time high. Finally, although they have been revised upwards, the RSI and the daily MACD indicate still bearish momentum. Nevertheless, it is interesting to highlight the formation of a bullish divergence. Once confirmed, this is intended to be encouraging for a bullish reversal.
The current technical analysis was carried out in collaboration with Elie FT, a passionate investor and trader in the cryptocurrency market. Today trainer at Family Tradinga community of thousands of own-account traders active since 2017. You will find Lives, educational content and mutual assistance around the financial markets in a professional and warm atmosphere.
Focus on derivatives (ETHUSDT)
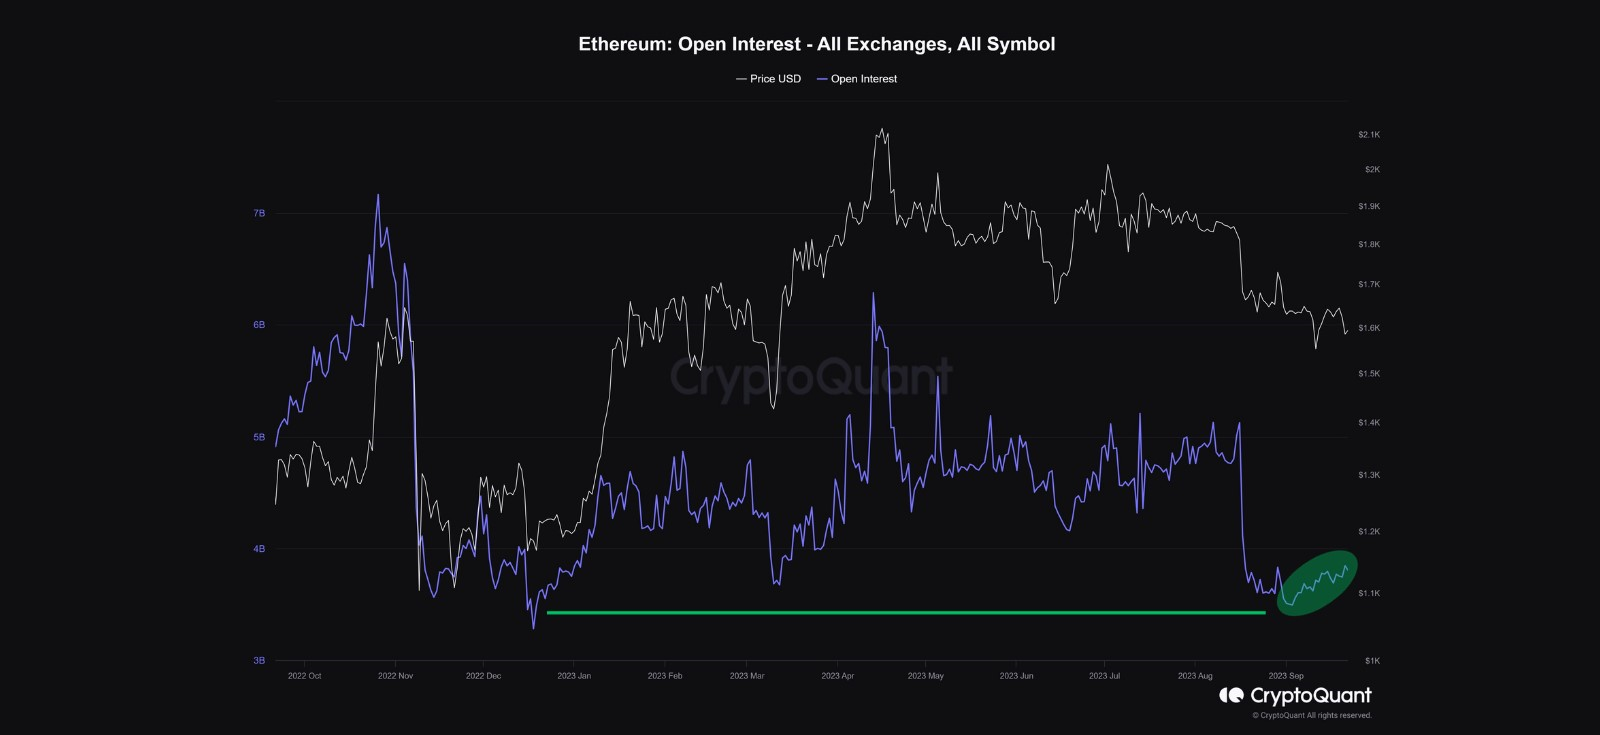
After reaching a lowest level since December 2022, open interest has been revised slightly upwards. This indicates renewed enthusiasm on Ethereum. Unfortunately, the fluctuations or liquidations of the cryptocurrency make it difficult to understand which positions are in superiority.
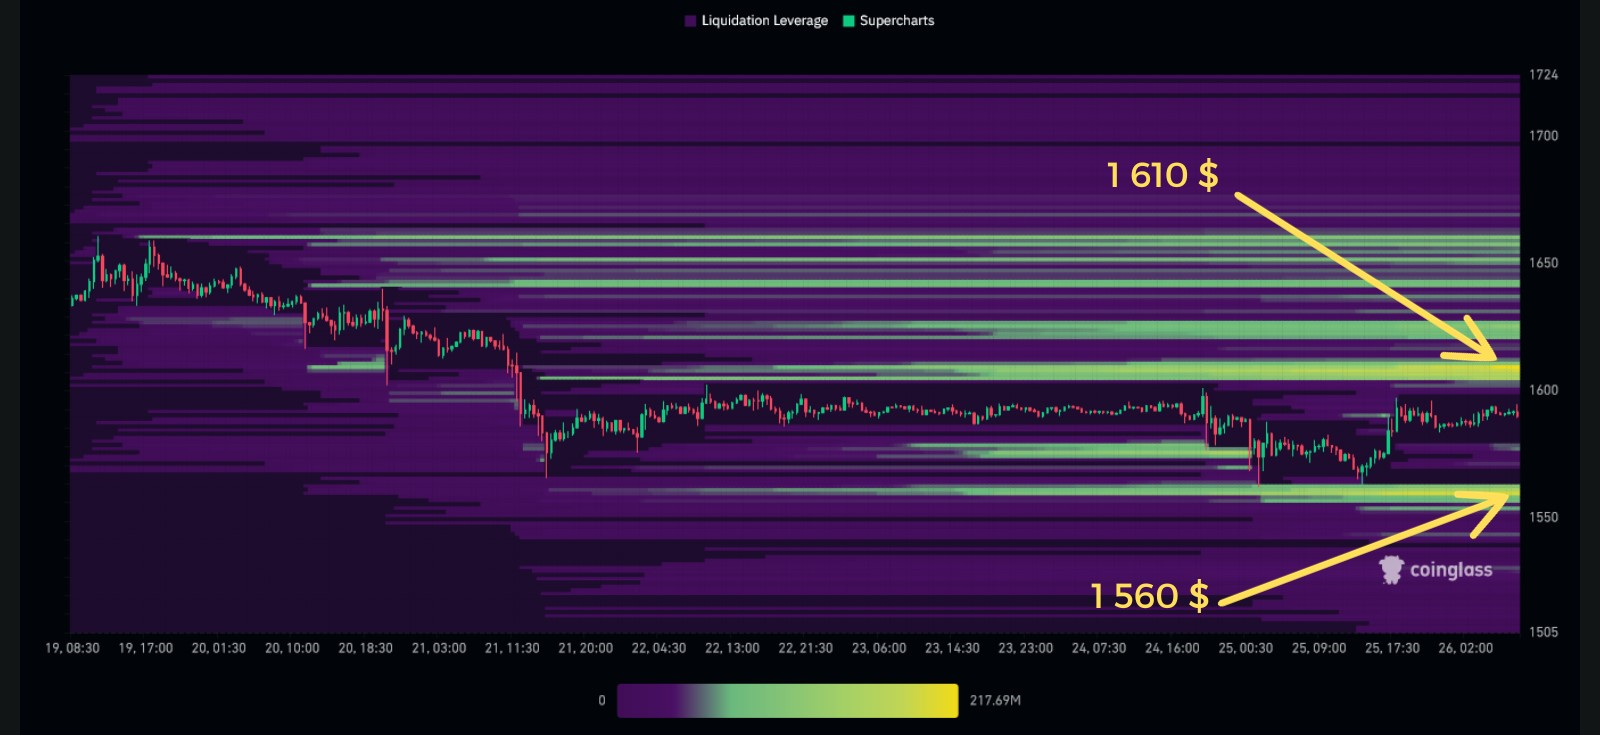
It is interesting to visualize the Heat Map of Liquidations on ETH. Indeed, we can see that the Ethereum price is between two high liquidity zones. These are found around $1,610 and $1,560. Contacting these could trigger a large number of deferred orders and/or forced liquidation, which can naturally increase the volatility of ETH.
Hypotheses for the price of Ethereum (ETH)
. If the price of Ethereum returns above $1,650, we could anticipate a bullish continuation to the level of $1,750-1,800. The next resistance to consider at this point will be the $1,900 threshold.
. If the price of Ethereum rejects $1,600, we could envisage a bearish continuation up to $1,500. Unfortunately, if this level does not hold, this could lead it, more or less quickly, towards the next support around $1,400.
Conclusion
Ethereum’s short-term trend is still bearish. Despite divergent factors with the latter, we must hope for a real return from buyers to witness a real reversal of the trend. Despite promising momentum, nothing is won. Thus, it will be important to carefully observe the price reaction on the different identifiable levels to confirm or not the different hypotheses made. Beware of potential “fake out” and “market squeeze” in each situation. Additionally, it should be remembered that these scenarios are based solely on technical analysis. The price of cryptocurrencies may change more or less quickly, depending on other more fundamental factors.
Receive a summary of the news in the world of cryptocurrencies by subscribing to our new service daily and weekly so you don’t miss anything of the Tremplin.io essentials!