

After a marked correction, Chainlink displays recovery signals. Find our complete technical analysis and the perspectives of the link.

In short
- Technical analysis: Stable spot at $ 15.90. Increased volumes, upward long -term trend, neutral medium term, short term in recovery. Momentum in improvement.
- Technical levels: the market oscillates between $ 10 and $ 27. Pivot at $ 13.25. Value areas at $ 14 and $ 24; Their breakup can trigger a movement.
- Analysis on derivatives: Open Interest up, CVD down with increasing prices: buying absorption. Low liquidations, light long bias. Positive funding, moderate bullish feeling.
- Forecasts: bias bias above $ 14.8, with target at $ 27.2. Under this threshold, lowering risk to $ 10.2. The macro and the geopolitical context will act as catalysts.
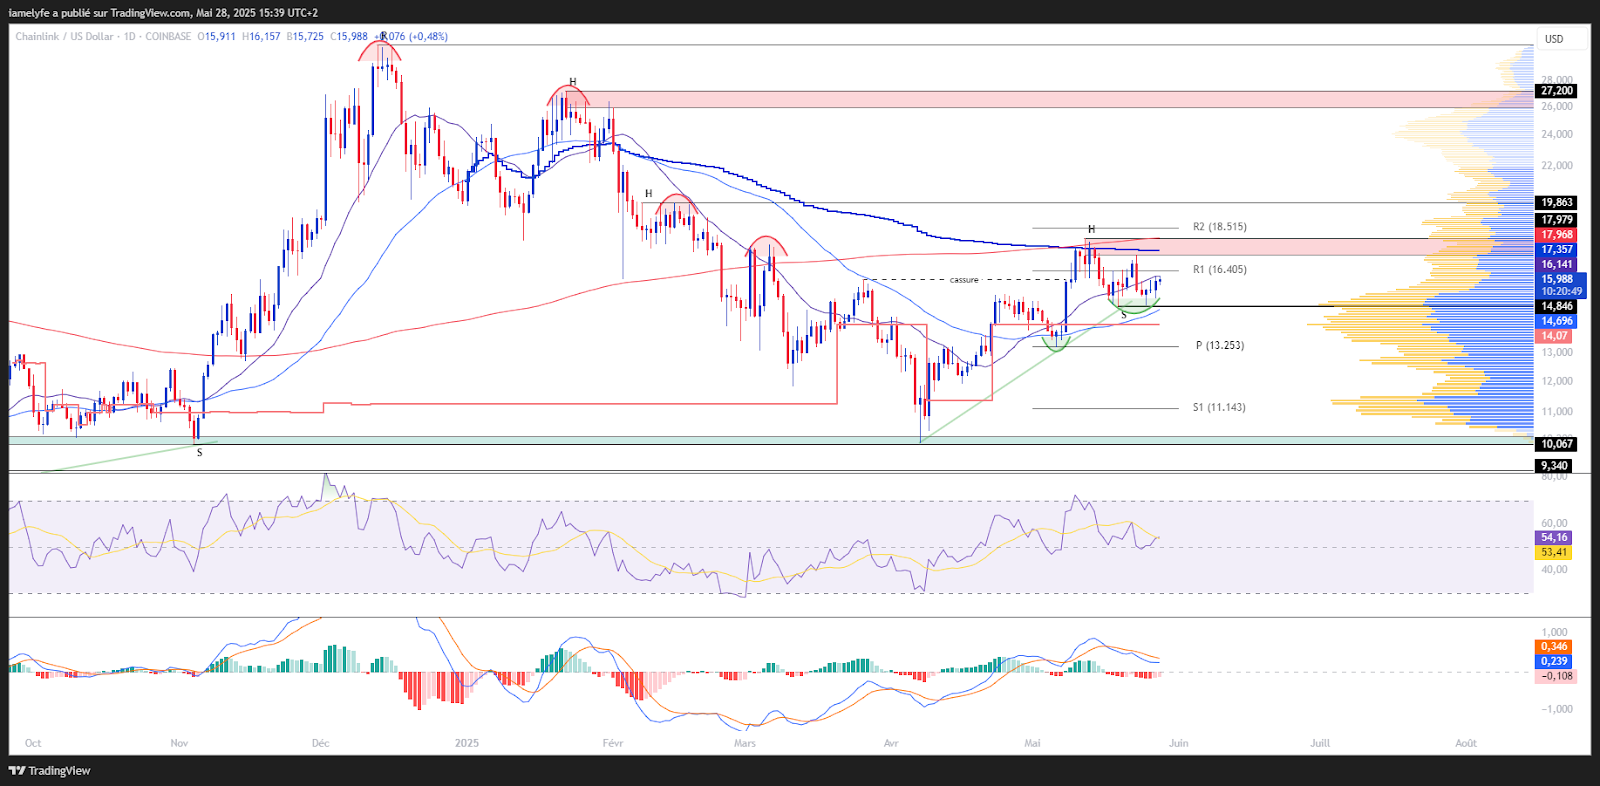
Technical analysis of the ChainLink (link)
| Spot price | ≈ $ 15.90 | The price remains stable around its recent level, without excess in one direction or the other. |
| Latest weekly variations | ≈ -2.36 % | Link decreases slightly over the week, without breaking of manifest structure. |
| Weekly spot volumes | ≈ 964 m (+1.70 %) | The activity remains sustained, with a slight increase in exchanges. |
| Long -term trend | Upward | The structure shows bull signs after a long bearish phase. |
| Medium -term trend | Neutral | The movement is under construction, awaiting a real bullish impulse. |
| Short -term trend | Upward | The upward trend is gradually taking place. |
| Momentum | Resumption | The signal gradually improves, revealing a bullish potential. |
The Link's spot price is maintained around $ 15.90, in a stable area without excess. Despite a slight weekly decline of -2.36 %, the overall structure remains intact. The weekly spot volumes progress slightly (+1.70 %), translating an activity that is always sustained. The long -term trend shows bull signs after a prolonged phase of weakness, while the medium term remains neutral, in a movement still under construction. In the short term, dynamics are gradually oriented. The momentum is recovered, carried by a signal which gradually improves.
Technical levels Chainlink (link)
| Resistances | $ 18 / $ 20 / $ 26 / $ 27 | Potential distribution zones; Their overtaking would open the way to an upward extension. |
| Supports | 14.8 $ / 13.2 $ /11.7 $ / $ 10 | Historical demand zones; Their break would expose a risk of downward prosecution. |
| Monthly pivot | $ 13.25 | Reference level for the trend of the month. |
| High value area | $ 24 | High volume area; Upper terminal of a market balance, beyond which an imbalance can emerge. |
| Low value area | $ 14 | High volume area; Low limit of a market balance, beyond which an imbalance can emerge. |
Link evolves between identified key areas. Resistors located at $ 18, $ 20, $ 26 and $ 27 correspond to potential distribution areas; Their crossing could catalyze a new bullish phase. Conversely, supports at $ 14.8, $ 13.2, $ 11.7 and $ 10 represent historical demand areas, the break of which would strengthen the risk of lower extension. The monthly pivot point at $ 13.25 is a strategic benchmark to assess the dynamics of the month. Finally, value areas at $ 24 (high) and $ 14 (low) delimit a market balance; Their crossing could point out the emergence of a directional imbalance.
Current technical analysis was carried out in collaboration with ElyfeAnd 0xhugzerinvestors and popularizers on the cryptocurrency market.
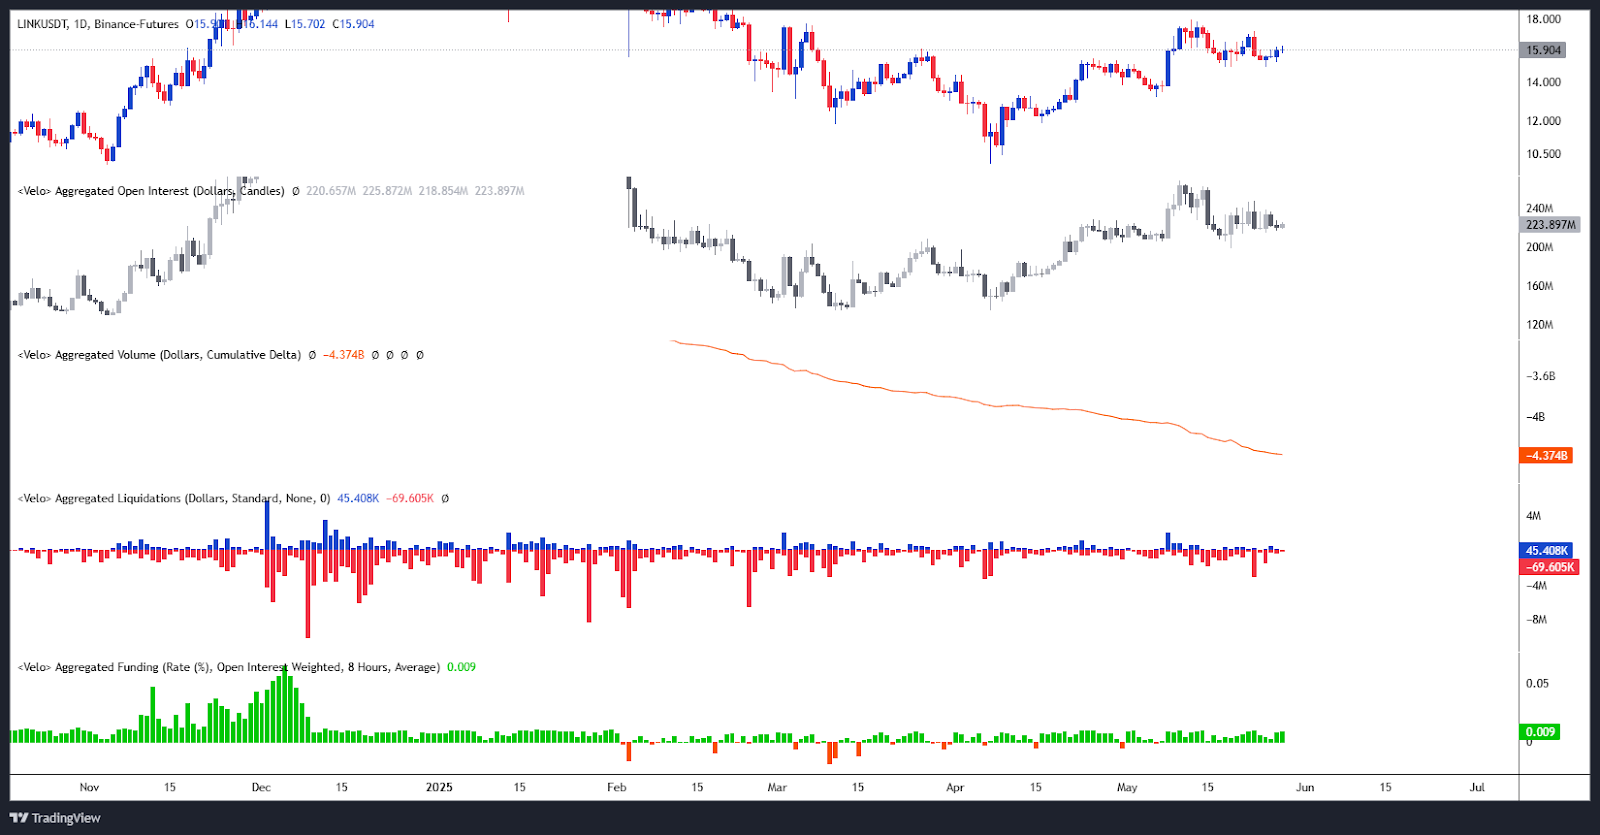
Analysis on derivatives (link/USDT)
| Open Interest | Increase | Rise of open positions, a sign of growing market interest. |
| CVD | TRADE ABSERMENT | The CVD is retreating, but the price remains stable, indicating a buying resistance in the face of the selling pressure. |
| Liquidation | Weak, long side | Globally low liquidations, but more on the buyer side, online with slight selling pressure. |
| Funding Rate | slightly positive | Light bias bias, moderate bonus for long positions. |
Market data reveal an increase in open interest, testifying to a renewed activity of stakeholders. The drop in CVD, combined with an increase in prices, indicates an effective absorption of sales by passive buyers. The level of liquidations remains limited, with a slight predominance of long positions, which is agreeable with moderate but persistent selling pressure. Finally, a funding spans weakly positive reveals a slight preference for buying positions, a reflection of a measured optimism on the market.
| Indicator | State | Comment |
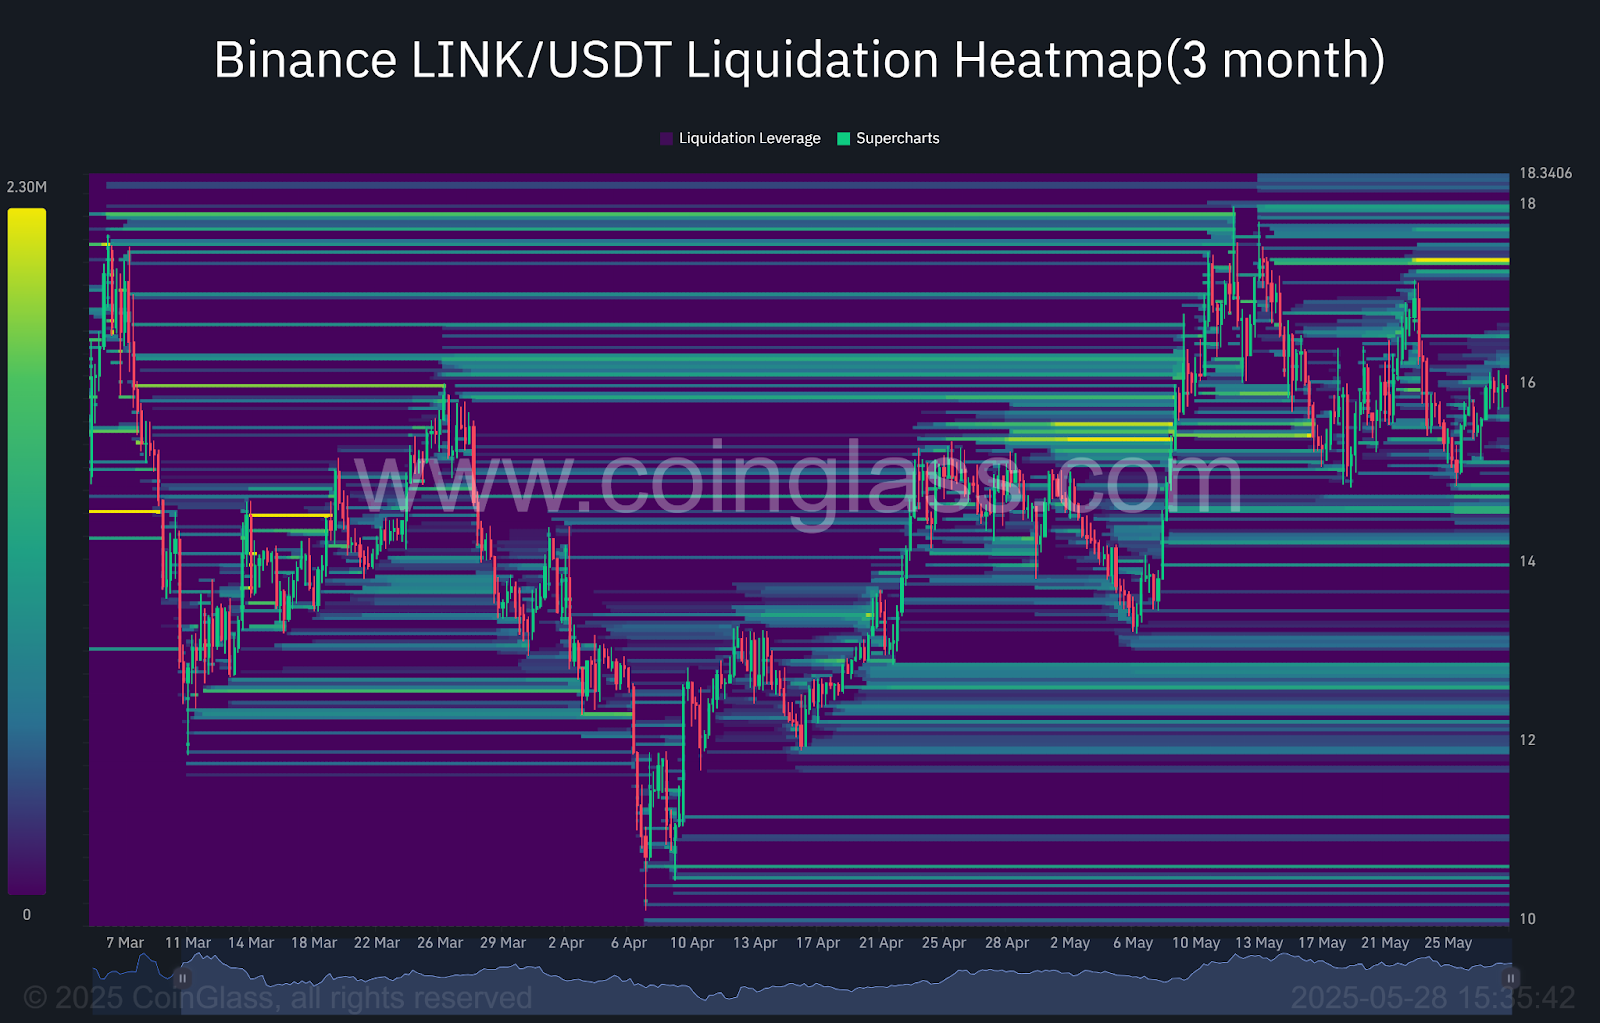
| Selling liquidation zone | ≈ $ 17.30- $ 17.50 / $ 17.60- $ 17.80 / $ 17.85- $ 18 / $ 18.10- $ 18.35 | Order concentration area; The achievement of these levels could result in an acceleration of volatility. |
| Buyer liquidation area | ≈ $ 14.70 – $ 14.40 / $ 12.80 – $ 12.30 / $ 12.20 – $ 11.85 | Order concentration area; The achievement of these levels could result in an acceleration of volatility. |
The market displays several areas of concentration of orders which can lead to an increase in volatility. In terms of seller, identified liquidation levels are $ 17.30 – $ 17.50, $ 17.60 – $ 17.80, $ 17.85 – $ 18.00, and $ 18.10 – $ 18.35; The approach or break in these areas could cause upward acceleration. On the buyer side, liquidation zones are located at $ 14.70 – $ 14.40, $ 12.80 – $ 12.30, and $ 12.20 – $ 11.85, and could cause sudden lower movements if they are reached. These key levels must be closely monitored to anticipate potentially violent market reactions.
Forecasts for the ChainLink course (link)
Haussier scenario:
- Conditions: Maintaining above $ 14.8.
- Objectives: $ 17.9 / $ 19.9 / $ 27.2.
- Potential: approximately +70 % since the current level.
Lower scenario:
- Conditions: breakdown of the support at $ 14.8.
- Objectives: $ 13.2 / $ 11.6 / $ 10.2.
- Potential: decreased up to -36 % since the current level.
Comment :
The bias remains bullied, but the American macroeconomic indicators as well as the news related to the global geopolitical context will be decisive to confirm this scenario.
Conclusion
ChainLink shows signs of progressive recovery in a still undecided market. The dynamics improve slowly, carried by a sustained activity and a moderate selling pressure. As long as the key support holds, the bias remains bullish, but the reaction of the market to macroeconomic and geopolitical events will be decisive to validate a real extension. In this context, it will be essential to closely monitor the reaction of prices at strategic levels in order to confirm or adjust current forecasts.
Finally, remember that these analyzes are based solely on technical criteria, and that the course of cryptocurrencies can evolve quickly according to other more fundamental factors.
Has this study interested you? Find our latest Bitcoin analysis.
Maximize your Cointribne experience with our 'Read to Earn' program! For each article you read, earn points and access exclusive rewards. Sign up now and start accumulating advantages.


