
Celestia has exceeded expectations since its listing. Let’s see the future prospects for the TIA price.
Situation of Celestia (TIA)
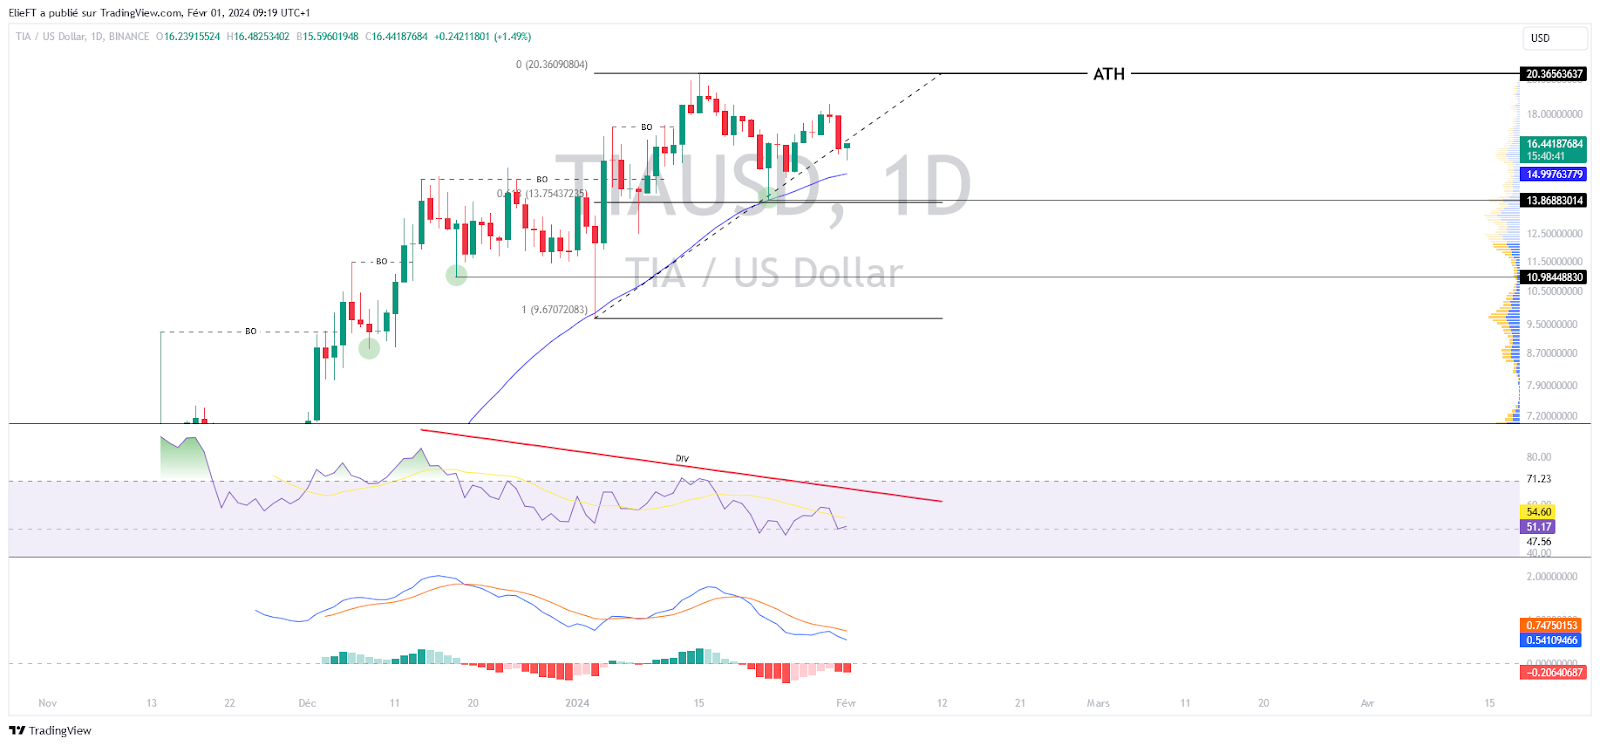
Since its introduction on Binance at the end of October 2023, the TIA cryptocurrency has recorded an impressive increase of more than 830%. Its price rose from around $2.5 to an all-time high (ATH) of $20.36, all in less than three months. Thus, TIA has successively crossed several peaks. Today, Celestia stock is trading around $16.3. Thus, Celestia began a correction phase which allowed it to reach a low point at $13.9. Since this price level, it seems that interest in the cryptocurrency has clearly resumed. Importantly, this rebound took place at the 61.8% Fibonacci retracement level, calculated from the $9.7 rise to its all-time high (ATH).
Given the youth of the cryptocurrency, it is not yet possible to view its 200-day moving average. However, Celestia is observed to be above its 50-day moving average, suggesting that the cryptocurrency is currently in an uptrend. That being said, it is clear that the TIA is showing increasingly weak buying momentum. This observation can be confirmed by the oscillators which are currently diverging from its course. From an optimistic perspective, this could suggest that the cryptocurrency is currently undervalued. However, from a more pessimistic angle, this could also be interpreted as a sign that Celestia’s momentum is moving towards a downtrend.
The current technical analysis was carried out in collaboration with Elie FT, a passionate investor and trader in the cryptocurrency market. Today trainer at Family Tradinga community of thousands of own-account traders active since 2017. You will find Lives, educational content and mutual assistance around the financial markets in a professional and warm atmosphere.
Focus on derivatives (TIAUSDT)
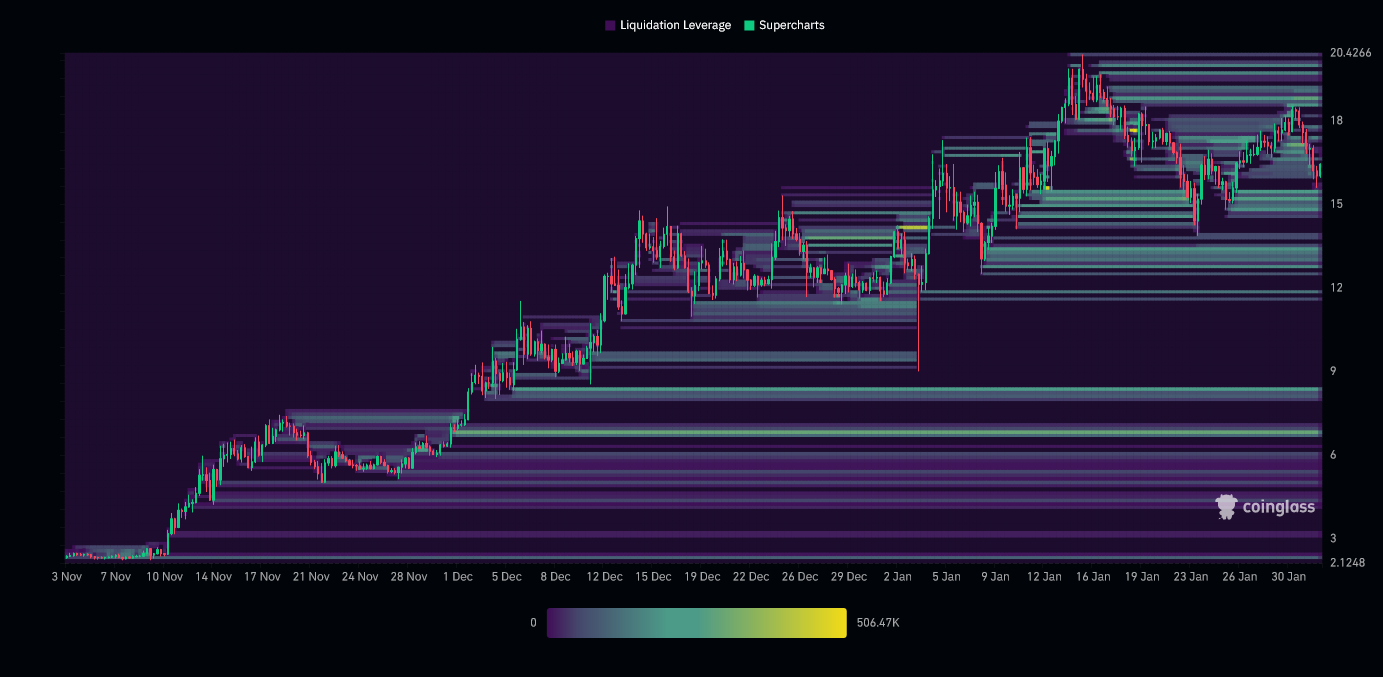
The liquidation heat map for Celestia reveals several important areas to consider. Below the current price, the $15 area is notable, followed by the $12 to $13 area. Above the current price, the areas of $18 to $19 and, even higher, that of $20, are worth highlighting. The price approaching these levels could result in a massive triggering of orders, increasing the possibility of a period of heightened volatility on Celestia. These areas therefore represent crucial points of interest for investors.
Assumptions for the price of Celestia (TIA)
- If the price of Celestia remains above $13, we could anticipate a continuation of the uptrend up to $18.5, or even up to its ATH. If the latter is crossed, the next bullish target could be $24, a level determined by Fibonacci extensions. At this point, that would represent an increase of more than 45%.
- If Celestia price fails to hold above $13, we could see a pullback towards the $12-$11 range. If the bearish movement continues, the next support level to consider would be around $8. At this level, the drop would represent around -50%.
Conclusion
Celestia continues to break historic records. It appears that its bullish momentum is starting to run out of steam. Although it is too early to question TIA’s bullish trend, it is important to remember the saying: ‘Trees don’t grow to the sky.’ Thus, it will be crucial to carefully observe the price reaction at different key levels to confirm or refute the current hypotheses. It is also important to remain vigilant against potential “fake outs” and “market squeezes” in each scenario. Finally, let us remember that these analyzes are based solely on technical criteria and that the price of cryptocurrencies can also evolve quickly depending on other more fundamental factors.
Maximize your Tremplin.io experience with our ‘Read to Earn’ program! For every article you read, earn points and access exclusive rewards. Sign up now and start earning benefits.