Bitcoin's short-term risk indicators have slipped into an extreme zone, reigniting debate over whether the market is approaching another major bottom. A widely followed metric, the Short-Term Sharpe Ratio, has fallen around -38.38 — a level seen only a few times in Bitcoin's history. Analysts tracking on-chain and statistical data say similar readings have previously coincided with long-term buying opportunities.

In brief
- Bitcoin's short-term Sharpe Ratio plunges to -38.38, a historically rare extreme reading.
- Similar risk signals appeared near the major lows of the 2015, 2019 and 2022 cycles.
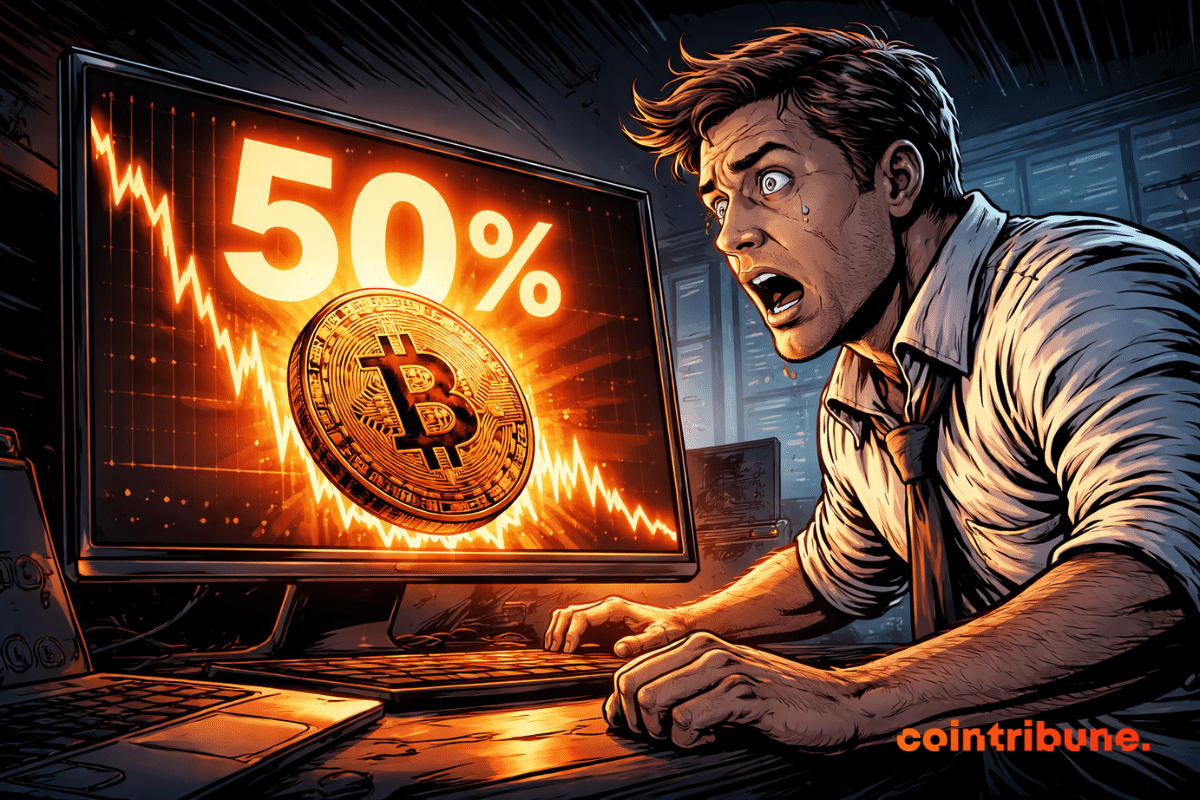
- BTC has fallen about 50% since its peak at $126,200, trading near $65,700.
- Analysts warn that macroeconomic risks could delay the recovery despite signs of stress in the market.
Sharpe Ratio Hits Unusual Low
According to CryptoQuant verified author Moreno, comparable extremes appeared near the cycle lows of 2015, 2019, and late 2022. Each period was marked by deep pessimism, heavy losses, and high volatility before prices experienced significant recoveries.
The Sharpe Ratio tracks returns relative to volatility. When this measure falls well below zero over a short period of time, it signals that investors are experiencing significant losses relative to price volatility.
A reading near -38.38 is among the most extreme on record. Reports suggest that Bitcoin is entered similar territory only four times. Each case followed intense market stress, with weakened sentiment and forced selling weighing on prices. History shows that these conditions can coincide with seller exhaustion, even when technical indicators remain fragile.
Past cycles provide context:
- Capitulation dominated trading activity, with many short-term holders exiting as losers.
- Liquidity has thinned with declining volumes and reduced participation.
- Volatility has increased, creating sharp intraday swings and emotional reactions.
- Long-term investors accumulated gradually as risk-return profiles improved.
These dynamics emerged around $287 in 2015, near $4,100 in early 2019, and around $15,000 in late 2022. Multi-month rallies followed in each case, reversing much of the previous declines.
Bitcoin Price Action Remains Fragile
Recent trading has been very sensitive to headlines and macroeconomic tensions. Bitcoin fell below key psychological levels as broader risk assets weakened. Thin liquidity has amplified reactions to geopolitical developments and political uncertainty, producing irregular price swings.
At times, BTC has managed to absorb outflows and stabilize. In other sessions, renewed selling pressure pushed prices lower, particularly as market depth faded. Short-term traders remain cautious, while longer-term holders watch for signs of a slowing downside momentum.
Extreme Risk Signal Emerges, But Bitcoin Bottom Remains Unconfirmed
A deeply negative Sharpe Ratio does not guarantee an immediate rebound. External pressures—including tighter liquidity conditions or unexpected macroeconomic shocks—can prolong weakness beyond historical averages.
Bitcoin's roughly 50% decline from its October 2025 peak near $126,200 to around $65,700 suggests that much of the damage has already occurred. However, additional volatility cannot be ruled out. Careful position sizing and disciplined entry strategies remain essential for participants considering exposure at these current levels.
Maximize your Tremplin.io experience with our 'Read to Earn' program! For every article you read, earn points and access exclusive rewards. Sign up now and start earning benefits.