After reaching a new ath of $ 109,354, Bitcoin faces a selling pressure, causing a decline in its course. Let us examine together the technical perspectives for the BTC.

Bitcoin course situation (BTC)
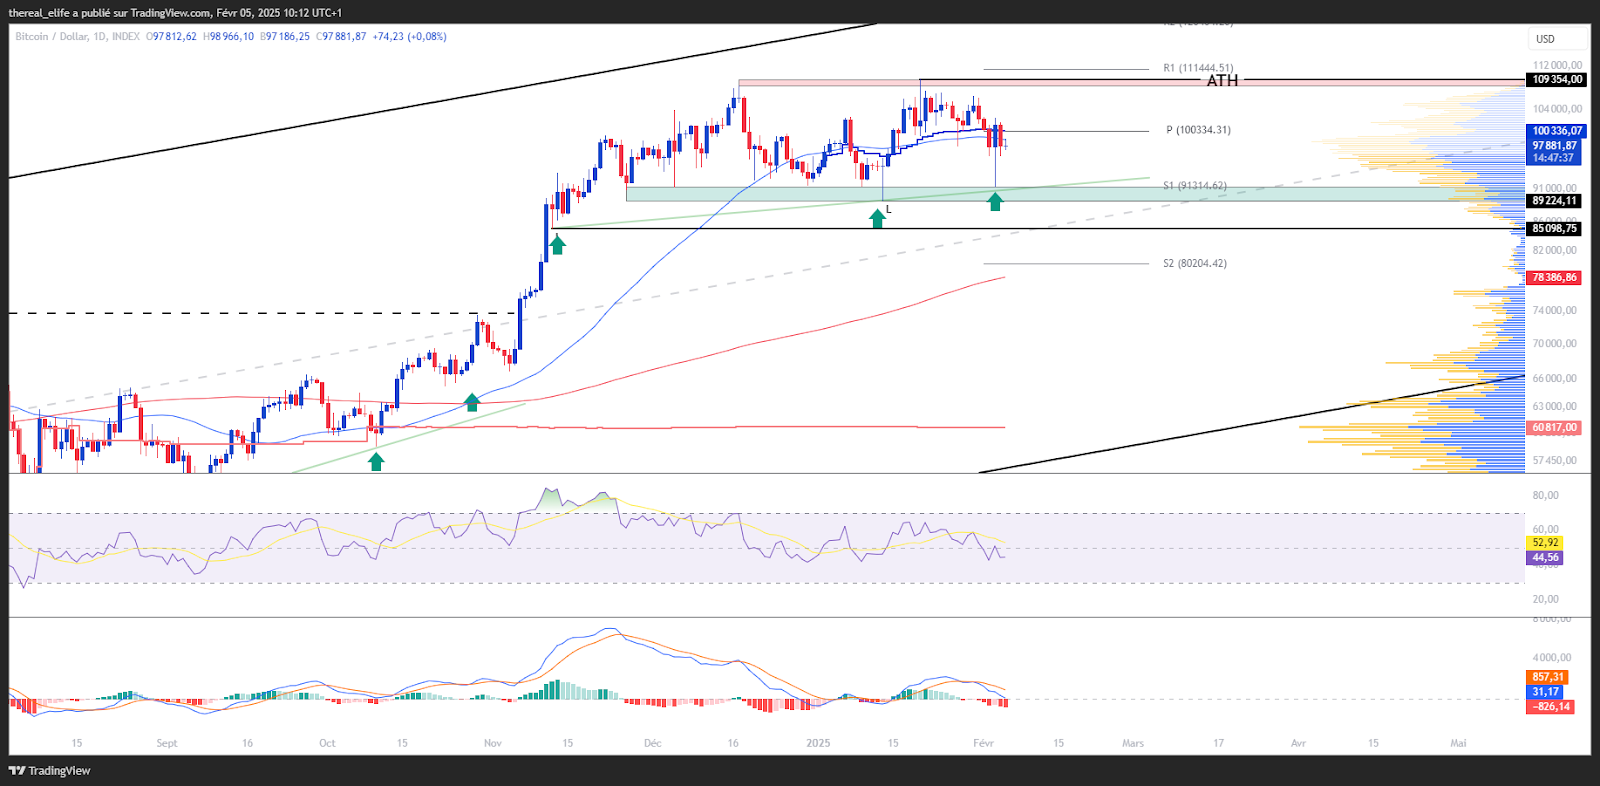
After reaching a historic record of $ 109,354, Bitcoin experienced marked volatility, bringing its course to the support of $ 100,000. Unfortunately, although a buyer interest has emerged, the latter was not enough to stop the decline. It was at the level of the first pivot support, located around $ 91,350, that the BTC course found refuge.
It should be noted that this correction was worsened by various events, such as the fall in NVIDIA action or, more recently, by the revival of the trade war by Donald Trump.
As worrying as it may have appeared, it is important to note that Bitcoin has not crossed its value zone, nor its support located between $ 90,000 and $ 89,000. Naturally, this suggests a next resumption of its course.
At the time of writing this text, the Bitcoin course is negotiated around $ 97,600. Although the short -term trend seems to have become down, the medium and long -term trends remain upwards. This observation is confirmed by the positioning of mobile averages over 50 and 200 days, crossed and upward -oriented. However, Bitcoin is now positioned below its annual VWAP, located at the same level as its monthly pivot point at $ 100,334.
On the side of the bruising dynamics of the BTC, it is not surprising that it has weakened as its course has dropped. This is reflected as much in its price as in its oscillators.
Current technical analysis was carried out in collaboration with Elyfeinvestor and popularizer in the cryptocurrency market.
Zoom on derivatives (BTC/USDT)
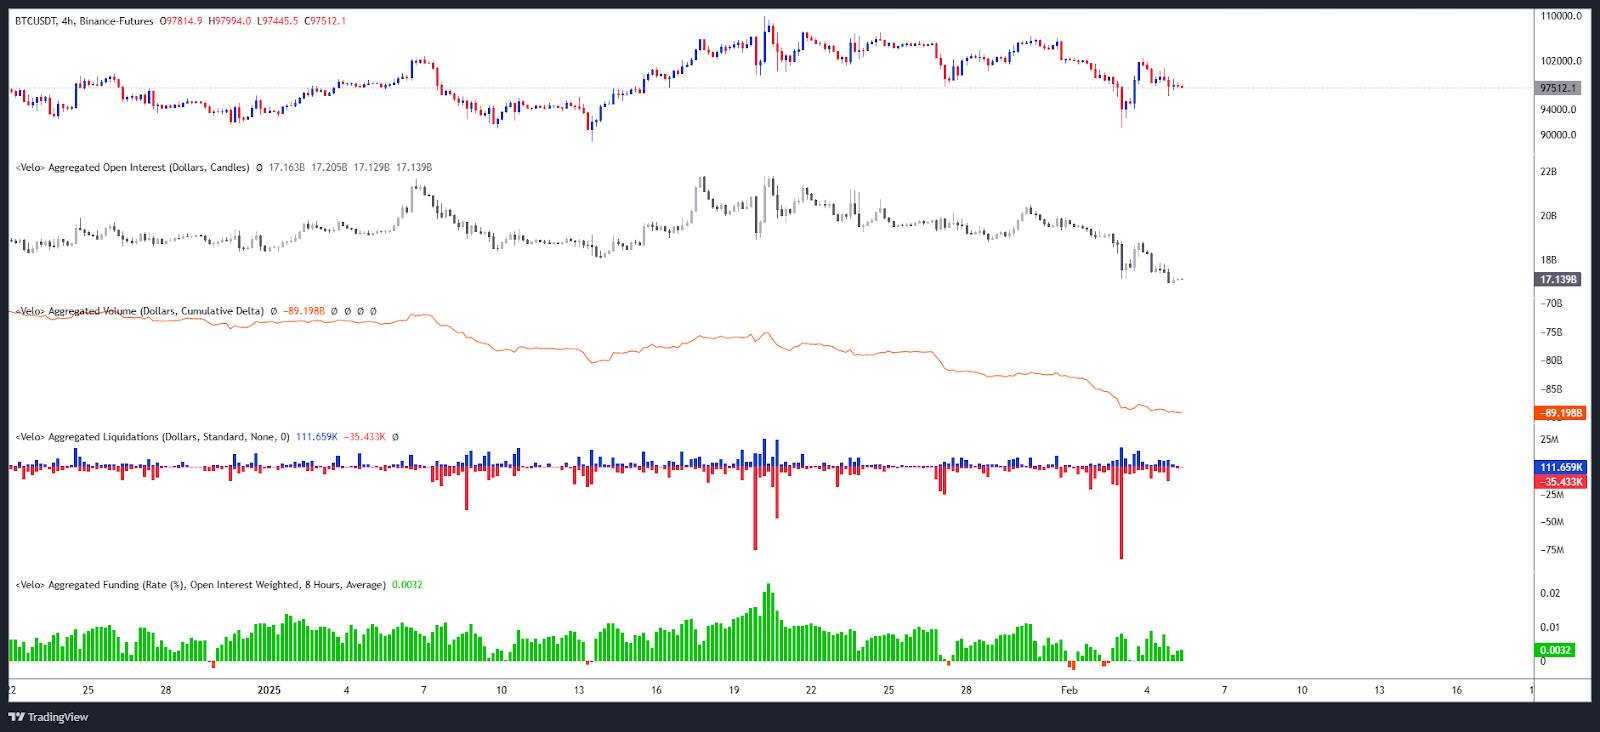
Open interest, the CVD and the funding rate of BTC/USDT perpetual contracts have all been revised downwards, as is the course of their underlying, indicating real selling pressure on cryptocurrency. However, although the course of BTC/USDT contracts shows signs of recovery, this increase is not yet accompanied by a significant increase in these indicators, which could translate a lack of enthusiasm or buying interest in this stadium.
The recent decline has led to significant liquidations of buying positions, marking a capitulation of buyers. Nevertheless, the observed rebound suggests a renewed progressive interest, which can announce a more sustainable recovery, as the latter is consolidated.
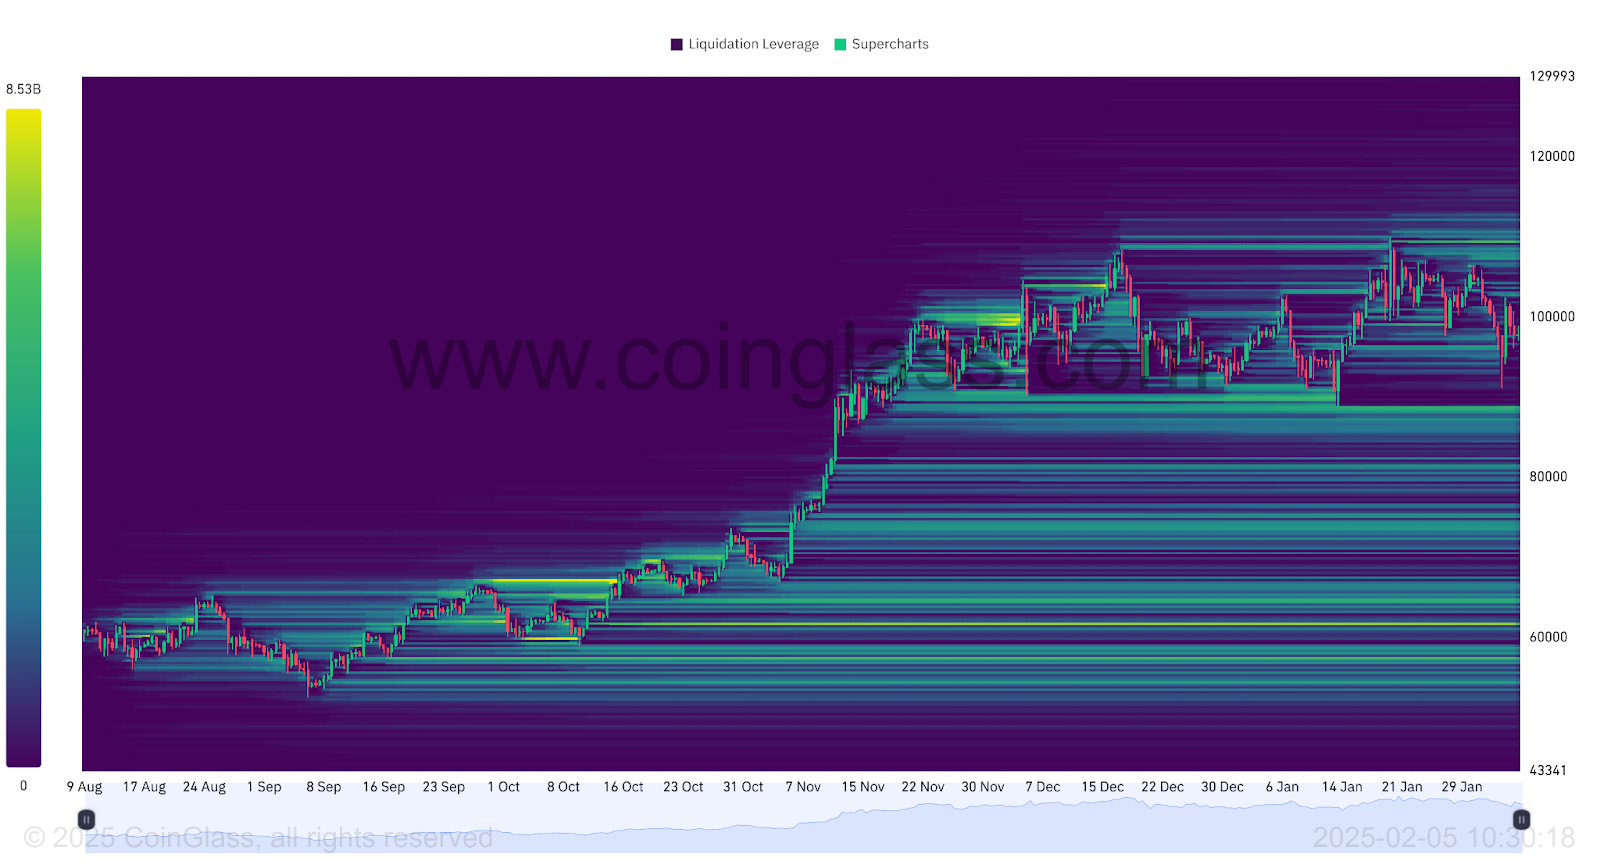
The thermal card of liquidations of perpetual contracts BTC/USDT shows that Bitcoin has reached a large liquidation zone below $ 96,000, before seeing its course rebound. This price level has thus aroused notable buyer interest.
Currently, the most significant liquidation areas above the current BTC price are around $ 103,000, $ 107,000 and $ 108,000, with an even higher level at $ 109,500. On the other hand, below the current course, key areas appear in $ 89,000, while the next major area is much lower, around $ 80,000 and $ 75,000.
If the price approaches these levels, this could trigger a large number of orders, thus increasing the risk of volatility for cryptocurrency. These areas therefore constitute crucial points of interest for investors.
Forecasts for the Bitcoin course (BTC)
- If Bitcoin manages to maintain itself above $ 91,300, a recovery could allow it to cross $ 102,400, thus paving the way for $ 106,000. Overcoming this threshold could then promote a return to its ATH at $ 109,354, an increase of approximately 12 %.
- On the other hand, if Bitcoin fails to maintain itself above $ 91,300, it could find a support around $ 89,450. A prolonged drop would then bring back its course to the support of $ 85,200. Finally, the break of this level could lead to a new fall to the area of $ 81,000 to 80,000, or even below $ 75,000, representing a drop of approximately 23 %.
Conclusion
Bitcoin experienced strong volatility after its historical summit, undergoing a correction influenced by external factors. Despite a marked bearish pressure, he preserved a key area, revealing a pursuit of the upward and long -term upward trend. In this context, it will be crucial to closely monitor the price reaction at strategic levels to confirm or adjust current forecasts.
Recall that this analysis is based solely on technical criteria and that the cryptocurrency market remains sensitive to many fundamental factors. At the same time, other dynamics deserve attention. Find our latest analysis of January 23.
Maximize your Cointribne experience with our 'Read to Earn' program! For each article you read, earn points and access exclusive rewards. Sign up now and start accumulating advantages.