

The course of bitcoin has become financialized with its democratization. In addition, bitcoin’s sensitivity to monetary and financial dynamics is very high. Some analysts even point out that bitcoin acts presciently against stock market indices. In this paper, we will try to study the correlation between stock market indices and the price of bitcoin. We will therefore try to find out whether or not bitcoin is actually an indicator for traditional markets.
A strong correlation between bitcoin and indices
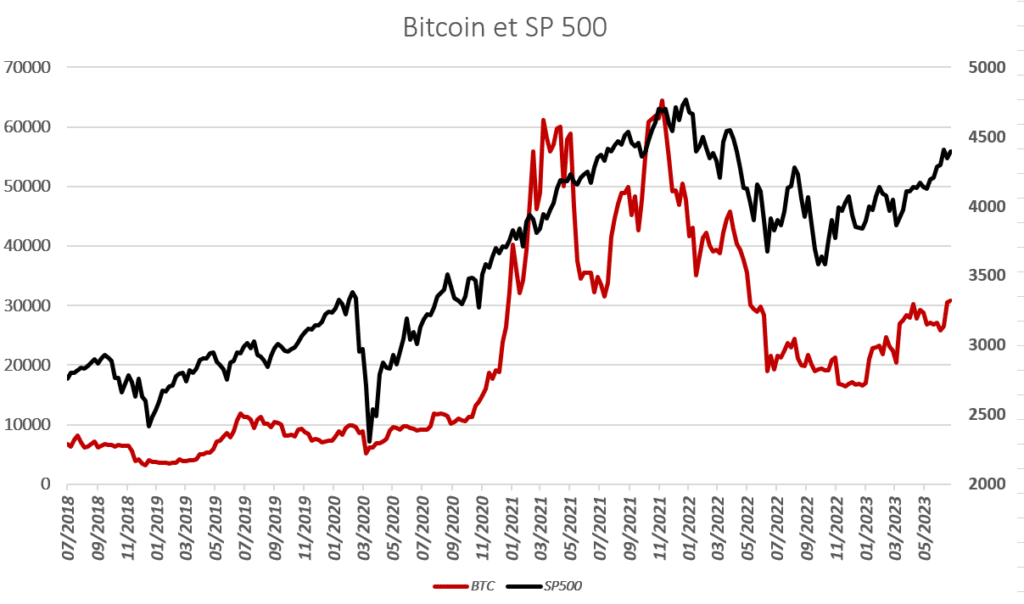
This is a fact now known to most analysts. The correlation coefficient between bitcoin and indices is very high in the long term. Indeed, according to the weekly data studied, the correlation coefficient between bitcoin and the S&P 500 over the period 2018-2023 amounts to +86%. This figure is consistent with values observed in the past. It is clear to our mind that the trajectory of bitcoin is dependent on those of stock market indices.
Moreover, the correlation generally tends to decrease in the medium term (a few months). Sometimes the correlation is even negative. The graph below shows the price of bitcoin (black curve) and the correlation between bitcoin and the S&P 500 (red curve). It is clear that large periods of correlation follow rather brief and antagonistic troughs.
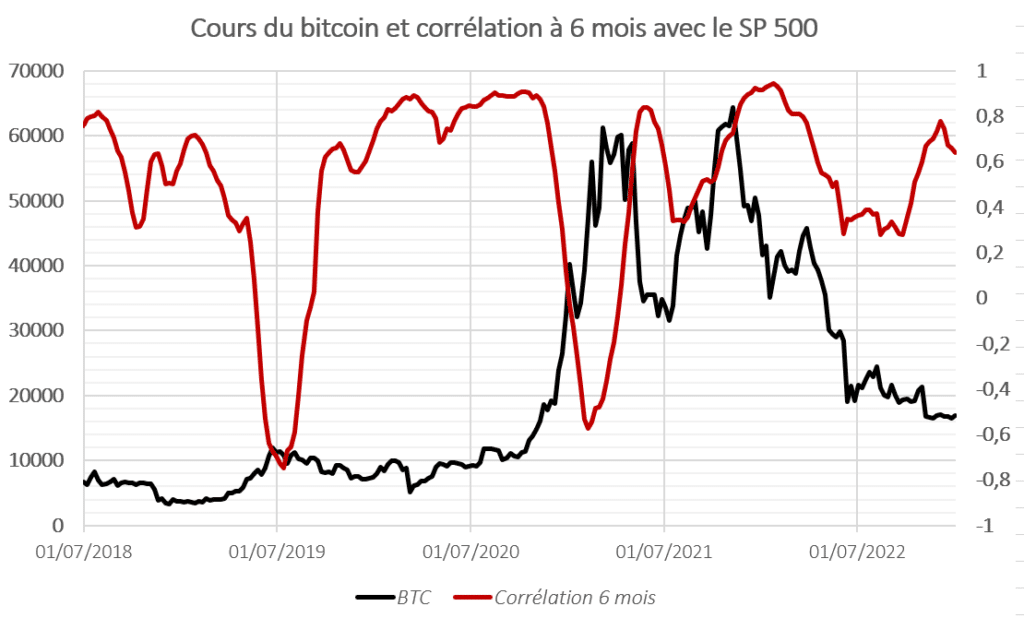
Thus the correlation between bitcoin and the indices is generally minimal, even negative, in the presence of major bitcoin peaks. That is, bitcoin sometimes temporarily behaves in an inverse way to the indices, before the return of a correlation movement. Therefore, we can expect that a divergent movement between bitcoin and the indices will be followed by another convergent movement.
In addition, it is important to note that we have selected weekly data for the sake of simplicity. Indeed, the indices are open 5 sessions per week while the cryptocurrency exchange does not close…
The issue of bitcoin instability
In our previous study, we showed that the volatility of bitcoin reduces over the long term.
“Indeed, the rise of bitcoin in the long term generally results in the reduction of its volatility. Bitcoin thrives on decreasing long-term volatility. Then, over a few months, bitcoin, on the contrary, feeds on an increase in volatility to increase its performance. […]
On the other hand, we have shown that a minimum in the volatility of stock market indices often reflects a maximum in the price of bitcoin. Conversely, the rise in bitcoin over the long term will more frequently be positively correlated with the rise in index volatility. But at the same time, increases in index volatility over a few months can be a source of bitcoin declines. Bitcoin therefore does not protect against “shocks” or “panics”. On the other hand, it benefits from the growing instability of the long-term indices, which is not negligible. »
Volatility and Bitcoin (BTC) – Tremplin.io
Consequently, the recent rise in the price of bitcoin does seem to be accompanied by a significant decrease in the volatility of the indices. The VIX, the volatility benchmark on the S&P 500, has fallen below the 13 level. This is simply the lowest level of volatility since January 2020. Consequently, any resumption of volatility on the traditional markets would be likely to slow down the rise of bitcoin.
Bitcoin reversals precede index reversals?
Significant trend reversals in bitcoin often seem to precede those in indices. Bitcoin marked notable highs in December 2017, November 2018, June 2019, February 2020, August 2020, November 2021, April 2022, etc. Meanwhile, the S&P 500 highs were January 2018, September and November 2018 , July 2019, February 2020, September 2020, December 2021, etc… In addition, bitcoin’s difficulty in making new highs in the spring of 2021 could be interpreted as a signal of market weakness.
However, the lows of stock indexes are generally more virulent. They often precede bitcoin lows. In any case, the absence of a total correlation between the two indices makes it possible to detect anomalies. These anomalies are usually quickly corrected.
The observation is not contradicted by the statistical data. Indeed, the correlation with a bitcoin price set back a few weeks in time is identical. However, if we start to calculate the correlation with a backward price of the S&P 500, then the correlation decreases.
Why such a correlation?
The importance of this correlation is notable. In addition, this should be put into perspective with the strong correlation between available liquidity and the price of stock market indices. Consequently, it is observed that bitcoin is now included in a larger and more connected financial system than ever before.
First of all, the general sentiment of investors and traders can influence both stock markets and the cryptocurrency market. In times of optimism and confidence, investors may be inclined to invest in both stocks and Bitcoin. This implies a positive correlation between the two assets. Similarly, in times of pessimism and uncertainty, investors may seek to turn away from both stocks and Bitcoin. In this case, there is a negative correlation between the two assets. But we have seen that these periods were rarer.
In addition, certain macroeconomic events or indicators can have an impact on both the stock markets and Bitcoin. For example, central bank decisions, monetary policies, interest rates, currency fluctuations and economic indicators, etc. All of these can influence both traditional market investors and those in the cryptocurrency market.
Bitcoin: a financial asset?
But the most likely explanation is to be sought from the stakeholders. The growing adoption of Bitcoin by traditional financial institutions plays a major role. There may be similar capital flows and investment strategies between stock markets and Bitcoin. For example, some large institutions may invest in both stocks and digital assets, which may create a correlation between these two asset classes. Cryptocurrencies are then perceived as a minority asset class. The managers’ adjustments are then more flexible on bitcoin, which is quickly bought (or sold) according to liquidity needs.
Bitcoin/S&P 500 ratio
The bitcoin S&P 500 ratio is therefore a very interesting case study. Indeed, we adjust the price of bitcoin to the price of the S&P 500. This allows us to see if bitcoin is outperforming (or underperforming) the S&P 500. It is intriguing to see that the current level of the ratio (close to 6) is exactly similar to that of spring 2022. That is to say that bitcoin has not really outperformed traditional indices for 1 year. At its highest, bitcoin was worth 16 times the price of the S&P 500.
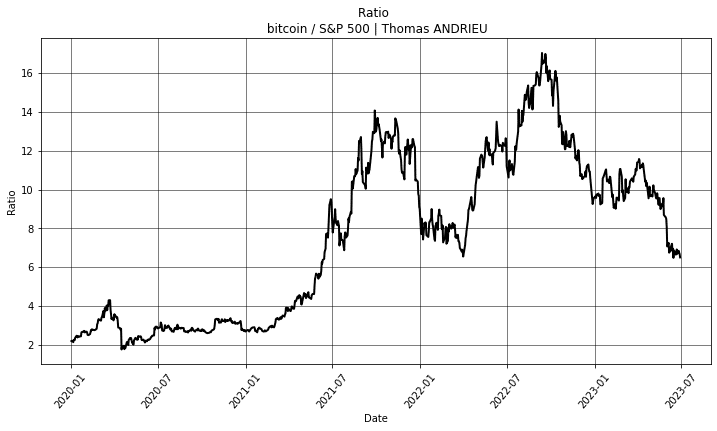
Consequently, the price of bitcoin would not be likely to fall too much compared to the S&P 500. It is obvious that the effectiveness of the support of this ratio is reinforced in the presence of a strong correlation. At the end of June 2023, the 6-month correlation between bitcoin and the S&P 500 is close to 70% to 75%. Which is enough to say that bitcoin will likely follow the trajectory of the indices. But we have seen that a return to volatility would penalize bitcoin.
Could bitcoin’s circulation speed be slowing down?
In a previous article, we showed that the price of bitcoin increased when it traded more rarely. Therefore, the continued strong correlation between indices and bitcoin is all the more troubling as bitcoin trades more rarely in the very long term.
“The evolution of the velocity of bitcoin, that is to say its speed of circulation, is pulled down by the rise in the price of bitcoin, and it is pulled up by the limitation of the quantity of bitcoin . The velocity of bitcoin is often maximum during phases of bitcoin decline. »
On the Issue of Bitcoin (BTC) Supply – Tremplin.io
But the scarcity of bitcoin exchanges could explain the partial decorrelation of bitcoin with indices. Indeed, during phases of bitcoin’s rise, the speed of circulation of bitcoin decreases, and the correlation with the indices weakens. That is, the correlation of bitcoin with indices is directly related to the speed of circulation of available bitcoins. The correlation between bitcoin and the indices persists over time because the speed of circulation of bitcoin evolves according to the phases of the market. This amounts to writing that as long as bitcoin remains speculative (subject to frequent trading), the role of liquidity is central, and the correlation to indices remains very high. Conversely, the price of gold shows a weaker correlation to the indices, because its velocity also seems weaker.
Receive a digest of news in the world of cryptocurrencies by subscribing to our new service of daily and weekly so you don’t miss any of the essential Tremplin.io!


