
After several sessions marked by losses, the cryptocurrency market is regaining some color. Bitcoin is rising after hitting its lowest level since the beginning of September, but this recovery is not yet enough to reassure investors. Despite a rise in prices on Friday, expectations remain cautious for the end of October. Between massive ETF outflows, neutral indicators and risks of further declines, the market is now looking for a clear direction for the coming sessions.

In brief
- Bitcoin rebounds to $82,837 after falling to $80,427.
- The total capitalization of the crypto market increased by 2.1%, to $2.89 trillion.
- Bitcoin ETFs record $728.9 million in outflows in two sessions.
- Prediction markets are pricing in a downside risk towards $80,000 or less in October.
Bitcoin rebounds, but the market remains under pressure
On Friday, the price of bitcoin was trading around $82,837, recording a daily gain of 1.38%. The day before, its price had however fallen to 80,427 dollars, its lowest level since the beginning of September. This return above $82,000 marks a recovery after several arduous sessions. However, the market has not yet erased the losses accumulated during the week.
At the same time, the total capitalization of cryptocurrencies increased by 2.1%, reaching $2.89 trillion on Friday. This increase remains limited compared to more than 3,000 billion recorded a week ago. At this time, bitcoin was approaching its annual peak, before sellers gradually regained control. The market therefore recovers part of its losses, without returning to its previous level.
Investor sentiment confirms this continued caution. The Fear and Greed Index fell to 56, down from 71 on October 2. It is now in the neutral zone, after a period marked by stronger optimism. This development shows that operators are still hesitant to strengthen their positions despite the rebound in prices.
Bitcoin ETFs heighten investor concerns
The movements recorded on Wall Street also illustrate this tension. Bitcoin ETFs suffered $484.9 million in net outflows on Wednesday, their worst day since June 25. On Thursday, withdrawals continued, with an additional $244 million according to the Decrypt ETF Tracker. These successive exits reflect a marked decline in financial flows towards these investment products.
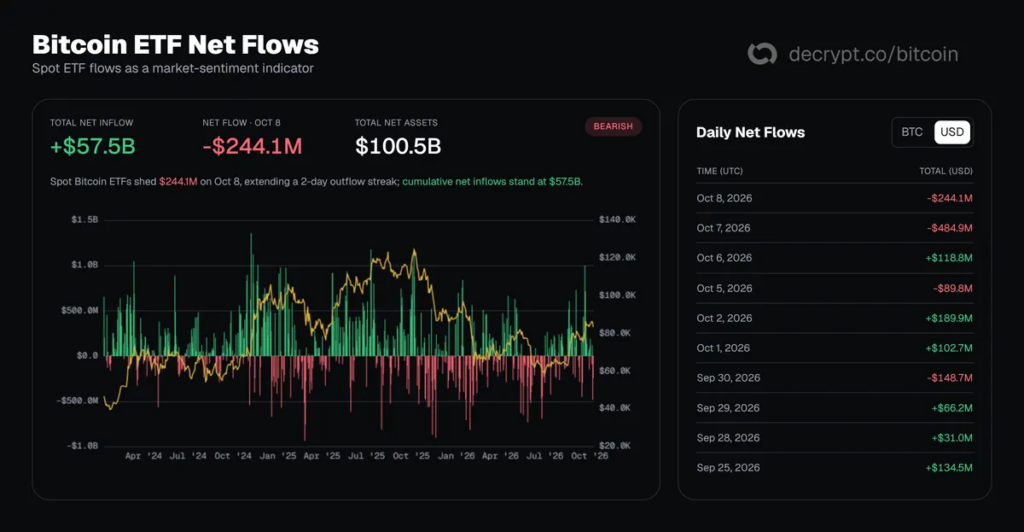
For bitcoin, these withdrawals are an important element to watch during the recovery. In particular, investors must determine whether buyers will return enough to support prices. For the moment, the available data does not allow us to confirm a lasting return of demand. Caution therefore remains in order, while the markets assess the risks of a further decline before the end of October.
Prediction markets reflect these contrasting expectations. On Myriadthe probability of BTC returning to $80,000 or less in October reaches 67%. Participants also estimate a 40% chance of a drop to $75,000, compared to 24% for $72,500. At the same time, the probability of a weekly close above $87,500 stands at 49%. These estimates illustrate the uncertainty surrounding what the market will do next.

What levels to watch after the bitcoin rebound?
Technical indicators provide shared signals. On the daily chart, the average directional index, or ADX, reaches 37.9, above the threshold of 25 associated with a strong trend. Directional lines favor buyers, since DI+ remains higher than DI-. However, on the four-hour chart, the price remains below the 50-period exponential moving average. This lag suggests that the rebound does not yet confirm a short-term trend reversal.
The relative strength index, or RSI, sits at 51.2, a level considered neutral. It indicates that the buying pressure has calmed down after an overbought phase. In a statement attributed to DecryptLuke Deans of Bitwise Europe believes that the $83,000 area represents an important first test for the rebound. It combines the average cost of ETFs with a previously high price level, which reinforces its attractiveness for traders.
A sustainable return above $83,000 could bring resistance at $84,433 back into play. Next, the September high at $87,354.33 would be a major threshold to surpass with a daily close. Conversely, a new failure could revive expectations of a decline towards $80,000, or even lower levels.
In the coming days, the evolution of ETF flows and the price reaction around these thresholds will be decisive. Bitcoin will have to confirm its rebound to reduce fears of a further decline. Without a lasting resumption of purchases, selling pressure could persist until the end of October. The next movements will therefore make it possible to better measure the solidity of this rise.
Maximize your Tremplin.io experience with our ‘Read to Earn’ program! For every article you read, earn points and access exclusive rewards. Sign up now and start earning benefits.