
It is possible that the bull-run will resume soon, as the whales begin to accumulate during this corrective phase. However, bitcoin (BTC) could experience new DIP lowers. Indeed, a pattern has formed on the price, suggesting the continuation of the current decline.
A descending triangle on bitcoin (BTC)?
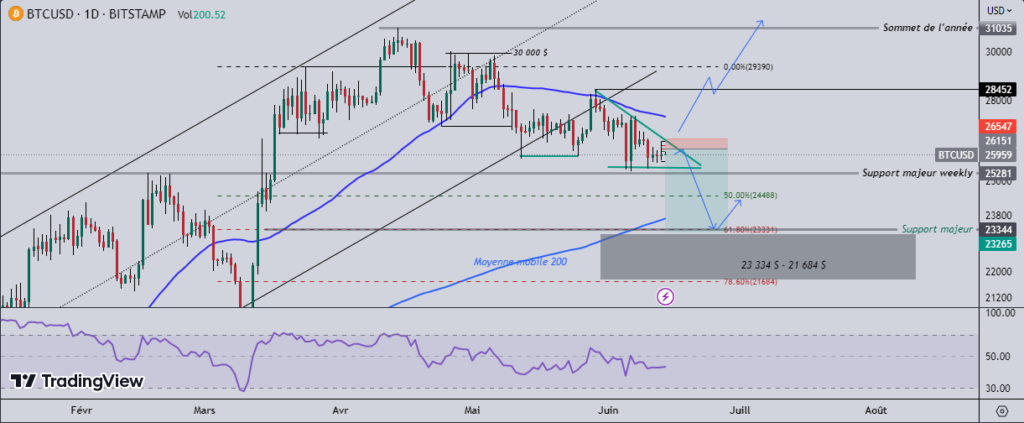
Currently, the queen of cryptos is registering a drop of 4.5% for the month of June. This is part of a corrective phase since the high reached this year at $31,035. This downtrend could extend ahead of a major rally in the long-term bull run. Indeed, a bearish pattern has formed on the price of bitcoin (BTC): a descending triangle.
This chart pattern suggests the continuation of the downtrend. Currently, BTC price is poised to break out of this downward triangle with increased volatility. Markets are indeed gearing up for the FED interest rate release later today, which could lead to additional volatility in bitcoin (BTC). If the price breaks this triangle down, BTC could experience a 10% decline. This would lead it to descend towards an area between the major support at $23,334 and the $21,684 level.
The 200-day moving average is near this area, suggesting that a recovery could be seen there.
The right time to sell?
Given the presence of this bearish pattern, shorting bitcoin (BTC) seems possible. Additionally, the Relative Strength Index (RSI) shows no signs of a change in the bearish pattern. Thus, it is likely that this potential drop of 10% will be realized. In this case, a sell position at $26,151 could be attractive, with the target area below $23,334.
If the triangle breaks up, this bearish assumption will be invalidated. A break above the $28,452 high would indicate a change in the current corrective phase. If confirmed, bitcoin (BTC) could hit a new yearly high above $31,000.
Admission: $26,151;
Stop: $26,547;
Goal: $23,334.
Receive a digest of news in the world of cryptocurrencies by subscribing to our new service of daily and weekly so you don’t miss any of the essential Tremplin.io!