
Over the last 8 years, September is the second worst month in terms of bitcoin (BTC) performance. In fact, the latter falls on average by 5% over the month of September. Conversely, the month of September is often a good opportunity. The end of the year often marks a powerful “Christmas effect” which is generally accompanied by a rise in cryptocurrency. But if the study of the past sheds light on the probabilities, it is appropriate to look at the indicators available on the price of bitcoin.
Seasonality at work?
In a special study, the seasonality of bitcoin was shown precisely (The seasonality of bitcoin (BTC) – Tremplin.io). The month of September is on average the second worst month since 2015. Indeed, the month of August often marks a weakening of the upward trend, before the month of September confirms a corrective movement. Furthermore, this observation is quite reliable, since 75% of Septembers have been bearish over the last 8 years. Which is a fairly strong statistical reliability.

September is followed by another very reliable upward month, October. In fact, the average performance of bitcoin in October is almost +25%. Additionally, October has the lowest drop frequency of the entire year. As a result, the month of October often appears to be an adjustment to the month of September. A rebound therefore seems to be taking shape at the start of autumn, but again, this is a generality.
In August, the price of bitcoin fell by more than 11%. A notable correction, which holds fragilely on the spring supports. The month of September opens with a slight decline, but nothing is won yet. If the month of August was more bearish than average, we can clearly see that the month of September could also have a divergent development.
September: a good time to return?
We saw that the dynamics at the end of the year were often favorable, but that this necessitated an often pitiful month of September. In this context, some would be willing to see the month of September as a good time to invest. But again, confirmation of the movement based on various indicators seems more reasonable.
“ 62% of the time, the price of bitcoin rises between (end) September and December. The average increase in the latter is more than 70% over the period in question. We therefore have a favorable seasonality in the fall for bitcoin.“
The seasonality of bitcoin (BTC) – Tremplin.io
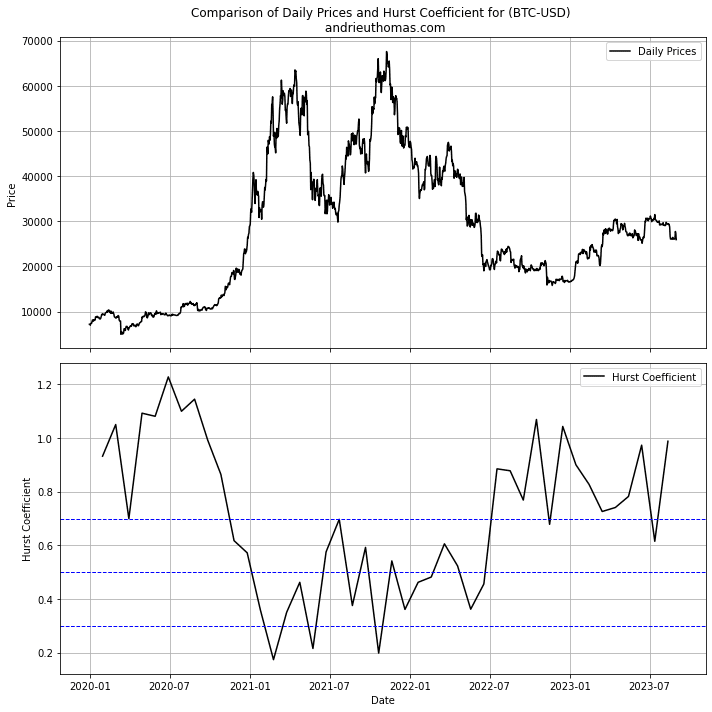
The chart below shows the price of bitcoin (bitcoin price, BTC). We see that the decline in August caused the BTC price to fall to June levels. In short, the summer was neutral and gloomy for cryptocurrencies. But since January 1, 2023, the price of bitcoin has continued to increase by more than 50%. It is interesting to remember that 2023 marks the end of the 2022 bear market (up to -75% from the highs). This lateralization of summer 2023 is therefore a gamble for investors in cryptocurrency: continuation of the decline in 2022 or a real bullish recovery?
It is also remarkable that the month of January 2023 was exceptionally successful (+40%). Likewise, the month of November 2022 was catastrophic (-16%) and marked the capitulation of the bear market. This also went against the seasonality observed in recent years. In any case, certain arguments and advanced indicators give us a certain probability of evolution of bitcoin for 2024 (Cryptocurrencies: a bull market in 2024? – Tremplin.io).
A trend weakened earlier than normal
As early as July 2023, we discussed the possibility that the price of BTC would fall back to the $25,000 to $26,000 zone. Which was the case. Maintaining this zone is absolutely crucial, as the long-term moving averages have once again been broken to the downside. Thus, the 200-week moving average stands at nearly $27,600. This level was tested during the week of August 28, but it resulted in another failure.
“ The major zone therefore remains that of $25,000 to $26,000. It is clear that the upward trend present since January 2023 is broken. This fall is mainly explained by the fall in stock market indices, the return of instability to them, and liquidation mechanisms. The abrupt nature of this movement could lead to backlash, but nothing is assured at this stage. Furthermore, the situation is not yet critical. The appeal remains in terms of volumes, volatility, and trend persistence. But it is clear that this movement induces doubt among investors who might have seemed too optimistic. »
Bitcoin capsizes, a reversal or a correction? (cointribune.com)
Furthermore, since January 1, 2023, bitcoin has been relatively correlated to the S&P 500 or the CAC 40. But this correlation remains lower than that of the long term. Furthermore, we will note the absence of correlation with the evolution of the dollar, which nevertheless influenced the rebound of stock indices. As a result, we can affirm that bitcoin is partly accompanied by the rebound in stock markets. Therefore, reassuring news on the economic or financial level is needed to await a potential bull market.
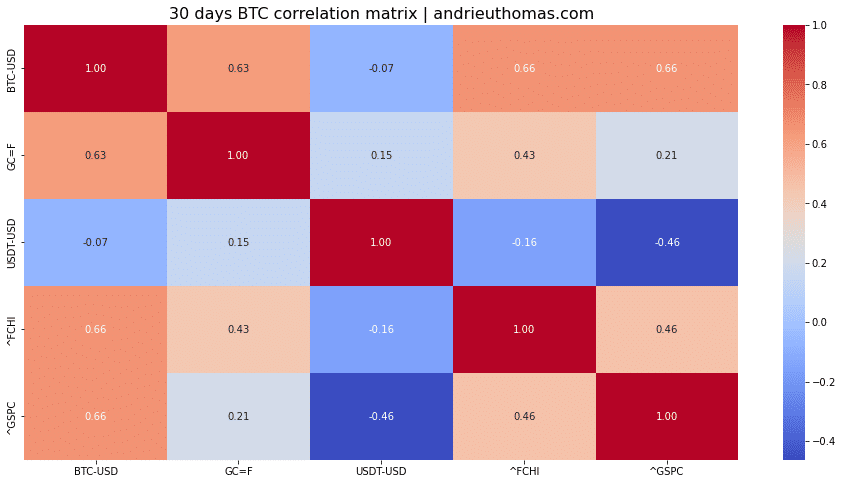
Furthermore, bitcoin minimums are often accompanied by a minimum correlation with the volatility of the indices. The price of bitcoin would therefore need to be relatively independent of the instability of the indices in September to confirm a potential rebound. In any case, a further bearish weakening would be very penalizing in the long term for the price of bitcoin (Bitcoin capsizes, a reversal or a correction? (cointribune.com)).
Bitcoin is struggling to regain volatility…
“Without an increase in volatility, no increase in bitcoin”, say the statistics. In fact, over the month of August, the decline in bitcoin was followed by a sustained decline in volatility. So we see, in the case of bitcoin, a lack of interest in the market. However, in recent weeks, the volatility of bitcoin has risen to almost 30%. Although this increase is not sufficient, it tends to support the hypothesis of maintaining the price of bitcoin (BTC).
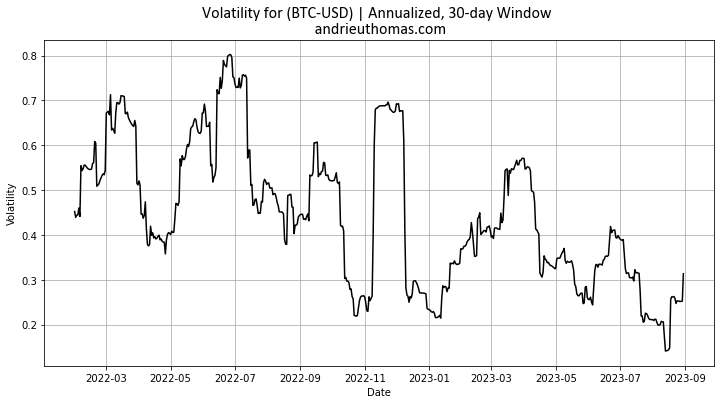
But it is clear that to see a sustainable rebound in bitcoin, bitcoin volatility would need to increase by the end of 2023. Fractals also show that the general weakness in volatility. A return of volatility on a daily basis would confirm the market recovery. Thus, the value of the Hurst coefficient on bitcoin remains high (close to 1). This suggests, barring a more lasting bearish market resumption, the possible persistence of major supports.
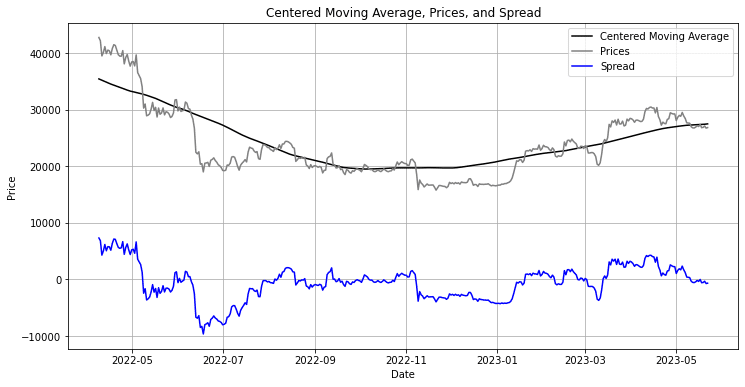
Finally, the chart below shows the price of bitcoin against its 200-day moving average. From this point of view, the price of bitcoin remains close to its “normal”. Consequently, if the trend remains bearish over a few weeks, the hypothesis of a bullish rebound cannot be excluded at this stage.
In conclusion
Ultimately, we have shown that seasonality could still have an unfavorable impact on the month of September. The month of August raised doubts about the trend that had been underway since January. A decline in bitcoin by the end of the year would cancel out the rebound generated since January 2023. Indeed, the month of September is often negative, but it is also generally followed by an upward movement. But this generality has exceptions. In addition, the trend in the price of bitcoin is already weakened, and the price of bitcoin remains between $25,000 and $26,000.
Furthermore, the correlation of bitcoin to most markets appears to be weakening. Confirmation of such a perspective would be rather favorable. But, on the other hand, we know that bitcoin peaks are often symmetrical to a minimum of index volatility. Any financial concerns would therefore be penalizing for BTC, and ultimately, could trigger a more persistent bearish dynamic. If the decline in August remains under control, a poor September would be very negative for the future. Conversely, the return to $27,600, then $30,000 and beyond, would on the other hand be the confirmation of a lateral movement, and potentially, of a more lasting upward recovery by 2024.
Receive a summary of the news in the world of cryptocurrencies by subscribing to our new service daily and weekly so you don’t miss anything of the Tremplin.io essentials!