

Between October 5 and 8, the cryptocurrency market experienced a marked correction, which caused bitcoin to decline by 7.59%. After hitting a low point at $80,393, the price rebounded towards $82,800. Despite this recovery, several indicators invite investors to exercise caution. Tensions on the market and movements towards exchange platforms fuel uncertainties, while the general trend remains upward.

In brief
- Bitcoin fell 7.59% between October 5 and 8, before rebounding towards $82,800.
- Funding rates and open interest are falling, prompting investors to be cautious.
- The market stress index fell to 7 after a weekly peak of 49.9.
- A return above $83,600 could signal the end of the correction, while a pullback towards $77,700 remains possible.
Bitcoin: a correction that weakens the market in the short term
Bitcoin fell from a high of $87,000 before regaining some of its lost ground. This recovery demonstrates a return of buyers after several difficult sessions. However, the rebound is not yet enough to confirm the end of the correction. Investors should therefore monitor the next price movements.
According to CryptoQuant datatrade flows evolved between the start and end of the period studied. From October 7 to 9, the platforms recorded outflows of 11,325 BTC. Over the entire period from October 3 to 9, outflows reached 7,520 BTC. These figures reflect significant movements, but their interpretation requires distinguishing daily flows from the overall balance.
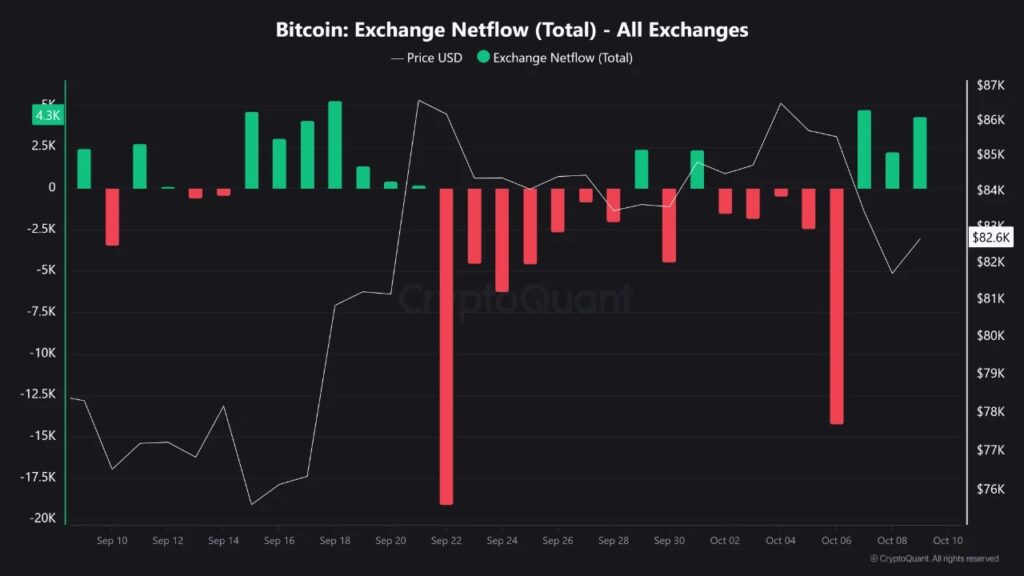
For his part, analyst CoinNiel notes several signs of caution. Funding rates declined and open interest fell compared to the start of the month. These developments suggest a change in the positioning of operators on derivatives markets. At the same time, negative flows from spot ETFs and the reduction of long positions increased the pressure on prices.
A decreasing stress index despite recent tensions
The Bitcoin Stress Index helps gauge the intensity of selling waves in the market. According to theanalyst Axel Adler Jr., this indicator reached a weekly high of 49.9 on October 7. A value between 40 and 55 reflects high tension among investors. However, the index has not exceeded the threshold of 55 in the last three months.
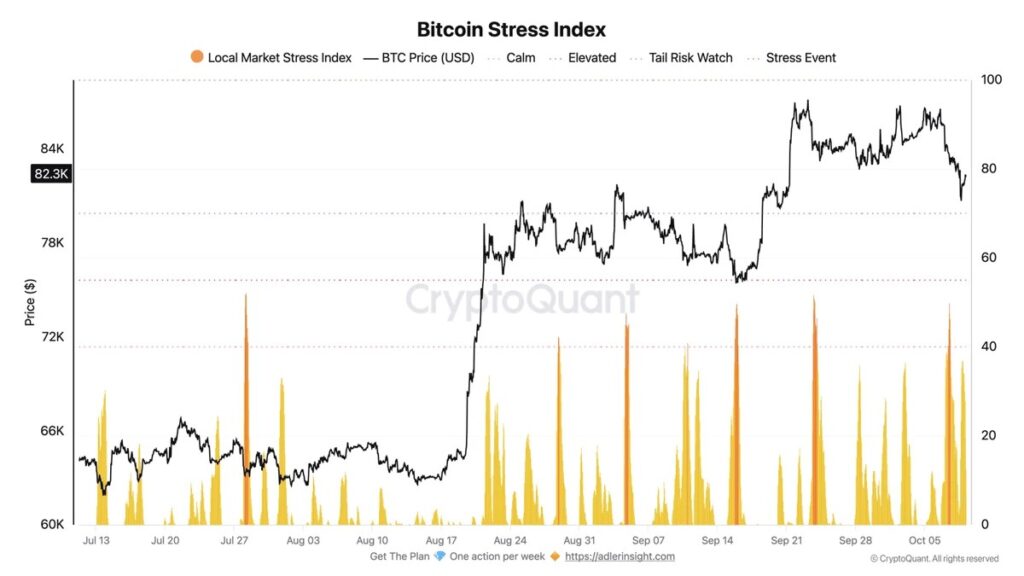
The significant liquidations recorded on October 7 and 8 on the futures markets then subsided. This development indicates a decline in the selling pressure observed during this period. The index thus fell to 7, which corresponds to a calmer market environment. However, this improvement does not guarantee that buyers will regain control in the long term.
Axel Adler Jr. identifies two levels to monitor to assess the risk of a further decline. A stress index above 55, accompanied by a price below $80,700, would constitute an important warning signal. The combination of these two factors could indicate a new phase of tension. Until then, the return to calm must be interpreted with caution.
What levels could guide the next evolution of the course?
On the daily chartthe structure of bitcoin remains bullish despite the recent correction. However, the price has fallen below the 50% retracement level, located at $81,230. This development shows that buyers have not yet erased all the consequences of the decline. A further decline towards $77,700 therefore remains possible.
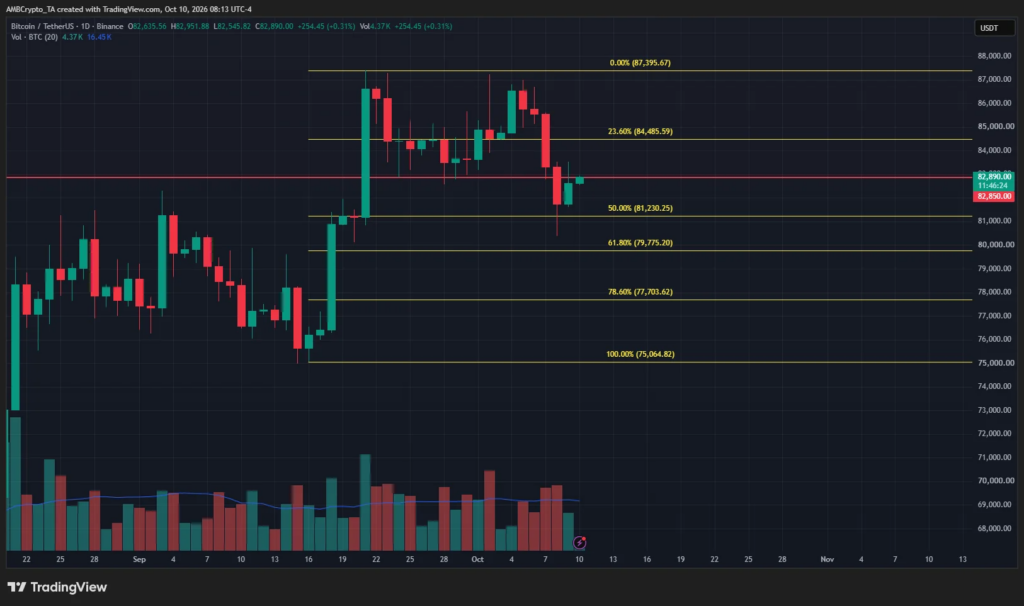
In the short term, maintaining the price above support levels could promote stabilization. However, market indicators do not yet confirm a lasting return to demand. Exchange feeds, funding rates and open interest remain important elements to track. Their evolution will help to better understand the strength of the current rebound.
The level of $83,600 now constitutes an important benchmark for the future. A return above this threshold could indicate that the correction is coming to an end. Conversely, a further decline below $80,700, associated with an increase in the stress index, would reinforce the risks of a decline. The market reaction around these levels should therefore guide future analyses.
BTC thus maintains an upward structure on a daily scale, despite a drop of 7.59% at the beginning of October. In the short term, investors will especially need to monitor the threshold of $83,600 and the risk of a decline towards $77,700. The continuation of the rebound will depend on the price’s ability to break through its next resistance, while stress indicators will assess whether selling pressure returns.
Maximize your Tremplin.io experience with our ‘Read to Earn’ program! For every article you read, earn points and access exclusive rewards. Sign up now and start earning benefits.


