

In my analysis last week, I warned that Bitcoin’s bullish move would only be valid if the price managed to consolidate above daily resistance and confirm a breakout above the 200-week exponential moving average (EMA). I also warned investors not to rely too much on ETF flows, because although purchases continued daily, their volume was gradually decreasing. I also pointed out that a rapid loss of this area would turn the move into a false breakout. Today, this scenario is starting to materialize. Bitcoin’s inability to sustain above the breakout level reinforces my bearish macro view and increases the likelihood of a correction to lower liquidity zones.

If we look at Bitcoin, we can see that it is currently trading between $66,000 and $60,000, with the $66,000 area acting as resistance. We have tested this level several times, although it previously served as support around the $65,000 region.
From a technical and psychological perspective, one of the biggest mistakes investors make is trying to predict Bitcoin’s exact bottom. Each market cycle brings countless predictions placing the bottom at a specific price, but the reality is that no one can accurately determine where a correction will end. Rather than focusing on a single level, I think it is much more effective to identify a high probability accumulation area.
As I mentioned when Bitcoin was trading around $120,000, my expectation was that the market would eventually move back towards the $60,000 zone, and my approach remains exactly the same. Could Bitcoin Drop to $45,000–50,000? Absolutely. Can anyone say this with 100% certainty? No.
This is why I believe any DCA (dollar average cost) purchase below $65,000 represents an attractive opportunity.
My strategy is not to buy the exact bottom of the market, but to gradually build a strong position through staggered purchases in a value area. The goal is not to obtain the perfect entry price, but to secure a competitive average cost to participate in the next bull cycle without depending on a single transaction. Historically, this approach has proven to be much more consistent than waiting indefinitely for the absolute bottom, which in many cases never arrives.
From a macro point of view, my vision remains unchanged compared to my previous analyses: the general trend is still bearish. Any bullish impulse observed should currently be seen as a movement intended to capture liquidity rather than the start of a lasting uptrend.
For spot portfolios, I continue to favor an accumulation strategy based on discipline, appropriate risk management and a long-term investment view, preparing positions for the next bull cycle. Historically, buying during periods when the market confirms a bear market and selling once the next up cycle is established has proven to be a very profitable strategy.
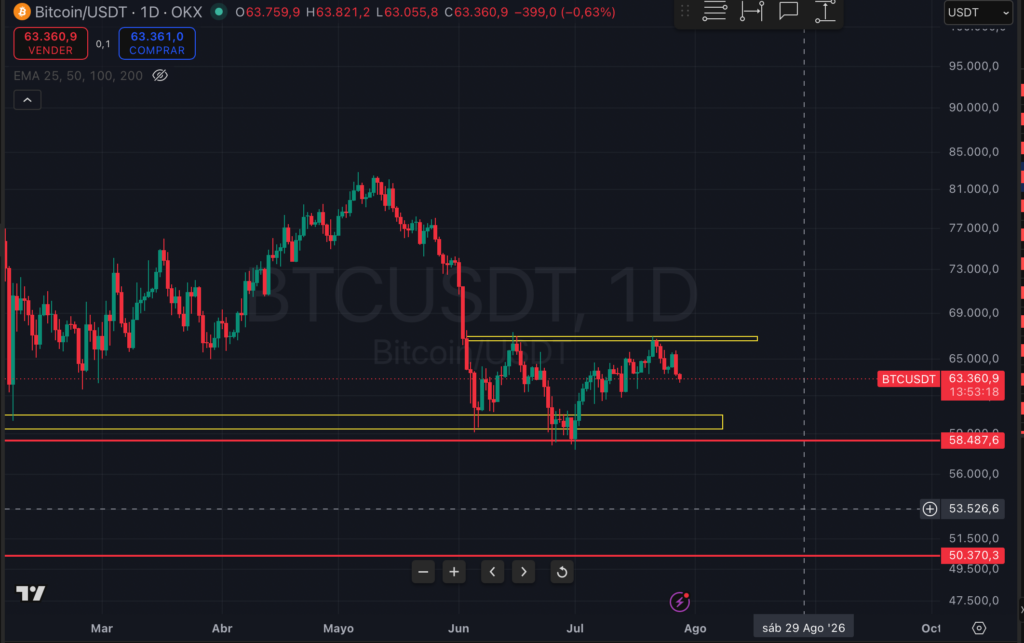
Bitcoin is now heading towards its key support at $60,000. If this level does not hold, I expect the market to revisit the $58,000 area, which represents the next important liquidity area to watch.
Maximize your Tremplin.io experience with our ‘Read to Earn’ program! For every article you read, earn points and access exclusive rewards. Sign up now and start earning benefits.


