The figure is chilling, and it is no coincidence. Shiba Inu futures saw a 666% surge in flows in a very short period of time. Behind this symbolic figure lies a much more nuanced market reality. Is the SHIB downtrend really about to reverse?
In brief
- SHIB futures flows exploded 666% in a short period, revealing intense speculative activity.
- The SHIB price remains below its main moving averages, in a still bearish chart structure.
- More than 531 billion SHIB were sent to exchanges at the beginning of March, increasing the selling pressure.
666%, a figure which hides a much more nuanced reality
This Thursday, March 5, 2026, market data highlighted a phenomenon that was striking to say the least: flows on Shiba Inu futures contracts recorded an increase of 666% over a short time window.
This spectacular jump, almost symbolic in its figure, signals a sudden wave of speculative positions taken around the famous token bearing the image of the dog. In short, traders rushed to derivatives marketsanticipating a significant price movement, upwards or downwards.
The SHIB was then trading around $0.0000056, with a slight intraday recovery. However, this rebound does not mask the essential: the chart structure remains deeply bearish. The price is still trading below its 50-day and 200-day moving averages, two trendlines that continue to point downward, confirming that sellers are still firmly in control.
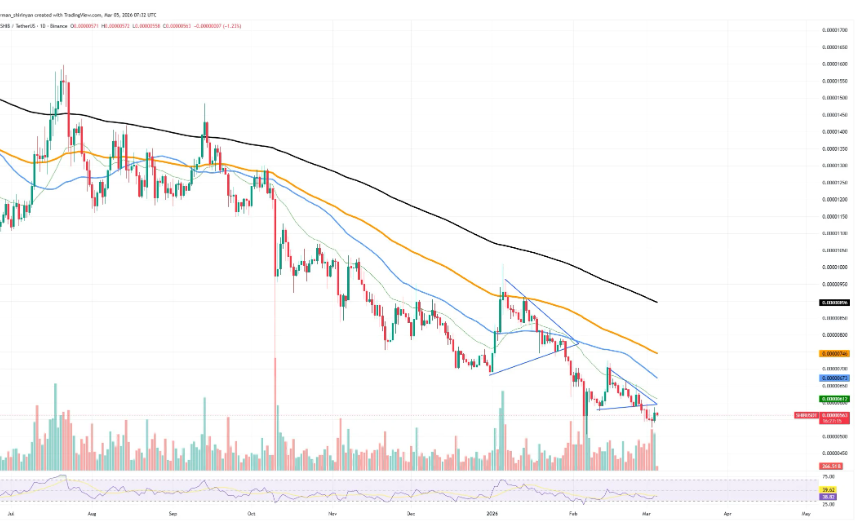
For several weeks, SHIB has formed a series of descending triangles on its chart. Each time, the pattern resolved in a downward direction. The current configuration follows the same pattern: the price sticks to the lower limit of the structure, without any real upward impulse.
This technical context partly explains why derivatives markets are racing: operators are positioning their bets before what looks like a new critical support test.
Added to this is a worrying on-chain signal noted at the beginning of March: more than 531 billion SHIB had been transferred to exchanges in just 24 hours. An entry volume well above usual trends, often associated with a desire to sell rather than accumulate. In illiquid markets such as weekends, this type of movement can considerably amplify volatility.
Bitcoin strong, SHIB fragile, a divergence that speaks volumes
The comparison with bitcoin is edifying. While SHIB sinks into a prolonged downtrend, BTC displays a much more robust chart structure, with momentum oriented towards $72,000 after consolidating around $63,000.
This divergence is not trivial: it illustrates the hierarchy of capital flows in times of uncertainty. Investors prefer to position themselves on the strongest asset, leaving speculative altcoins like SHIB behind.
For the Shiba Inu to find a second wind, bitcoin would first need to stabilize sustainably above $72,000. This psychological level could trigger an appetite for risk, and encourage capital to flow into more volatile assets, notably memecoins. But we are not there yet.
The 666% spike in futures flows confirms that traders are watching SHIB closely, but watching is not buying. Until price reclaims its key moving averages and bitcoin shows a sustained acceleration signal, Shiba Inu remains in the red zone. The next movement will be decisive: rebound or final capitulation.
Maximize your Tremplin.io experience with our 'Read to Earn' program! For every article you read, earn points and access exclusive rewards. Sign up now and start earning benefits.