

Bitcoin (BTC) is once again at a crucial crossroads after falling below $ 120,000, a movement accentuated by high capital outlets. For the moment, the Crypto OG oscillates around the rejection threshold of $ 120,000 and other key support areas. With a market in the consolidation phase, the traders scrutinize these levels while the BTC seems to lose momentum after several discharges on the summits of the cycle.

In short
- Bitcoin evolves laterally, carried by a balance between short and long -term holders.
- The market remains without strong speculative pressure, with overall balanced flows between cohorts.
- The price fluctuates around $ 115,000, while the bearish momentum tests key support areas.
- The current consolidation could draw a base before the next marked movement of Bitcoin.
Bitcoin under pressure, short -term holders hesitate
Analysts warn that the BTC could prolong its bearish trend if it crosses the lowest current of its range. Passing under $ 115,000 on Monday, short -term holders (STH) already feel the pressure of a movement towards the south. Historically, such rapid drops have led to strong fluctuations, pushing the most nervous investors to leave the market before the start of a new trend.
The Hodl structure of Bitcoin, as well as the graph of the flows of the last 30 days, offer additional lighting on this dynamic. The data highlights the balance between recently held bitcoin (“young parts”, generally associated with STH) and old parts (held by long -term investors, or LTH).
In the current cycle, many investors seem to favor expectations, retaining their assets without real intention of rotation.
The Hodl structure signals a neutral market regime to the highest historical
Analyst Crypto Axel Adler underlines that The Hodl structure of Bitcoin and flows over 30 days provide a better reading of the current state of the market.
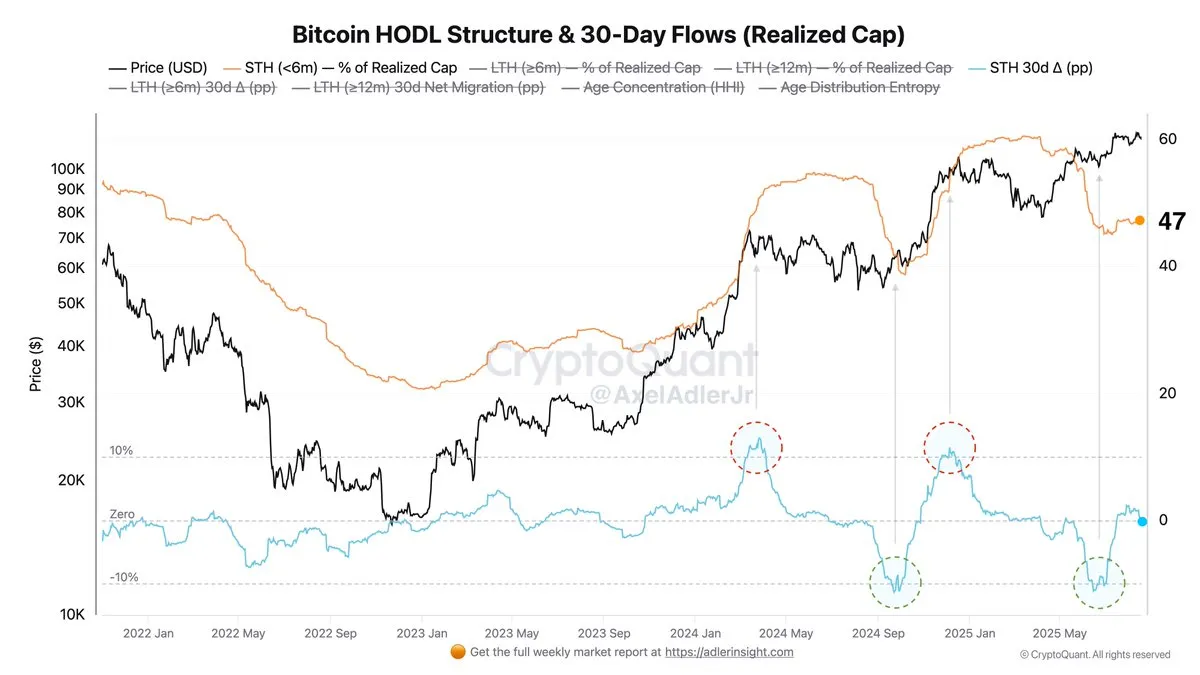
Here are the main teachings of the graph:
- The orange line shows the share of the value of Bitcoin (capitalization carried out) held by the STH (<6 months).
- The blue line (δ 30J STH) follows the evolution over 30 days, indicating if the parts pass from LTH to STH.
- When the blue line rises, this translates a rapid transfer to the STH, a sign of a high turnover and an overheated market.
- Conversely, a drop in the blue line suggests that the pieces are aging, indicating stronger holders (“diamond hands”) and consolidation phases.
Currently, Bitcoin evolves to its highest historical highs, with a STH share and a Δ 30 days respectively at 47 % and 0. A zero value of δ 30J shows that there was no rotation between STH and LTH in the last month.
According to Adler, this phenomenon reflects a balanced diet, without speculative purchases or notable selling pressure. Traditionally, a Δ greater than 10 % (red zones) accompanies local summits and overheating phases, while Δ less than -10 (green zones) reports capitulations and recovery.
In this context, Adler believes that the most likely scenario is a consolidation phase with short -term neutral pressure, allowing the BTC to form a solid base at high levels before its next significant movement.
Price action: nearly $ 115,000 with a lower momentum on a key support
At the time of the editorial staff, Bitcoin is negotiated at $ 115,186 after having evolved laterally during the recent intra -day session. TradingView data reveal an increase in volatility after several discharges around $ 123,463.
For the moment, The Crypto Reine evolves near the Bollinger band Lower and under the simple mobile average (SMA 20) located at $ 116,776, which confirms a short -term lower bias and suggests a possible passage in the occurrence zone.
In addition, the Bull Bear Power (BBP) indicator displays -1 943, confirming the domination of sellers at this level. In early August, the BBP still displayed strong green bars consistent with the rally above $ 122,000. Since then, the momentum has run out of steam and the histogram has remained mainly red, stressing persistent selling pressure.
The area between $ 114,000 and $ 118,000 thus remains a crucial decision -making area, which is likely to strongly influence the BTC trajectory. A break under $ 114,000 could open the way for a correction to previous supports, located between $ 110,000 and $ 112,000. Conversely, crossing over $ 118,000 could trigger new bullish impetus and bring the BTC price to the $ 123,000 rejection area.
Maximize your Cointribne experience with our 'Read to Earn' program! For each article you read, earn points and access exclusive rewards. Sign up now and start accumulating advantages.


