After consolidation around $ 96,500, Bitcoin underwent selling pressure, bringing its course to the support of $ 89,000. Find Elyfe's analysis to decipher the technical perspectives of the BTC.

Bitcoin course situation (BTC)
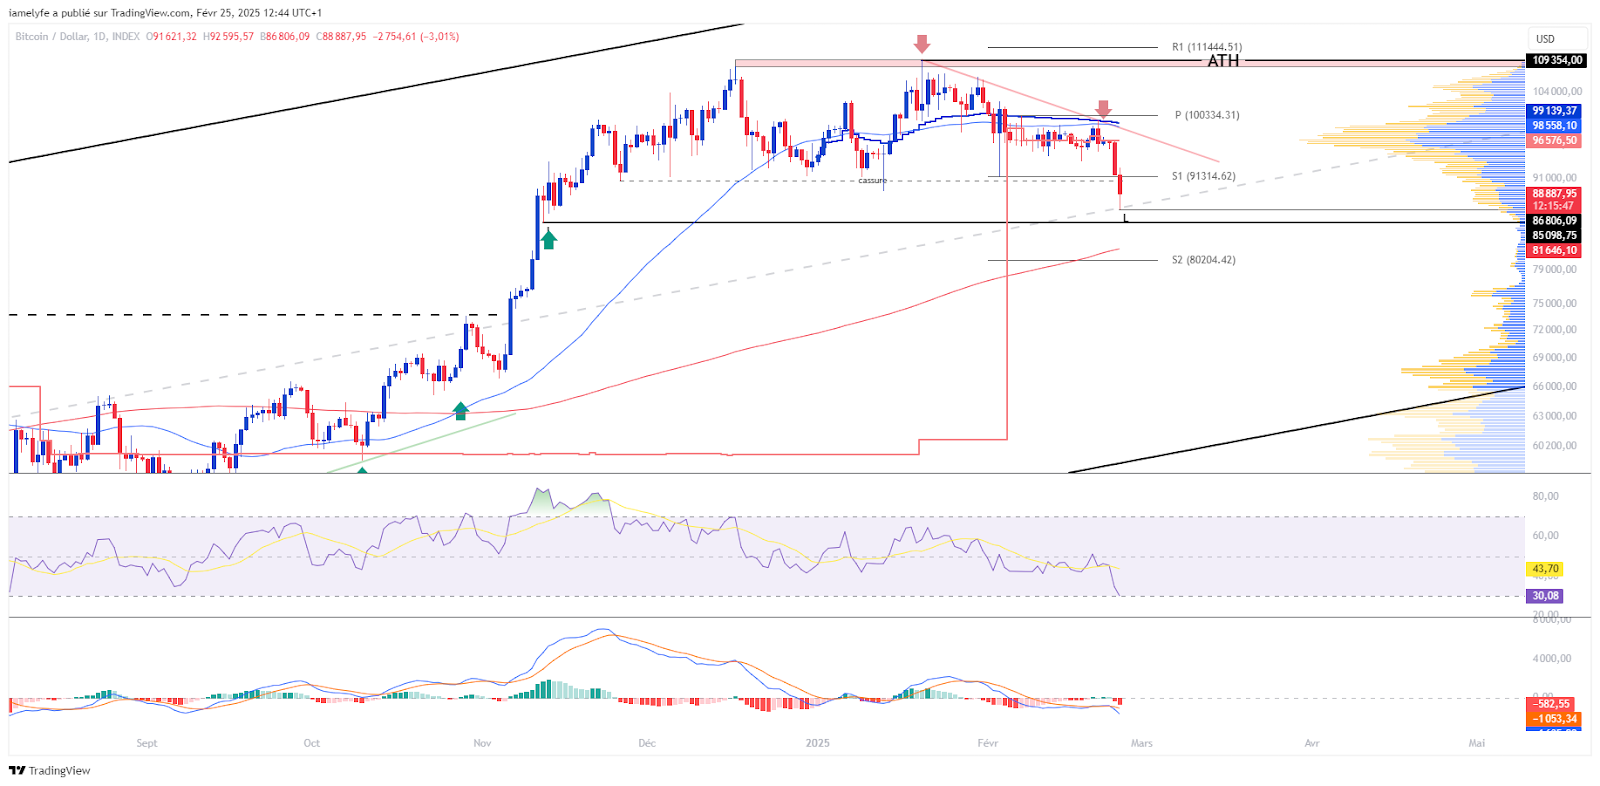
After trying a rebound since $ 91,350, Bitcoin consolidated between $ 93,450 and $ 99,150. Unfortunately, this area was crossed from below, confirming the hypothesis issued in the analysis of February 19, 2025. Indeed, Bitcoin fell by around 10 %. He went under the first monthly pivot support to reach the support area identified around $ 89,000, below the lower part of the range initiated since the end of 2024.
At the time of writing, Bitcoin is negotiated around $ 88,000. He reached $ 86,900, his lowest level from the new Bitcoin Ath. Cryptocurrency is now clear below a significant value zone, under the annual VWAP and its 50 -day mobile average, testifying to a clearly downward short -term trend.
Although the long -term trend remains upward, the medium -term trend is now neutral and could confirm a reversal as the decline increases.
Unsurprisingly, the bullish dynamic of Bitcoin was revised downwards. This is reflected both in its price and in its oscillators, which have reached new low points.
Current technical analysis was carried out in collaboration with Elyfeinvestor and popularizer in the cryptocurrency market.
Zoom on derivatives (BTC/USDT)
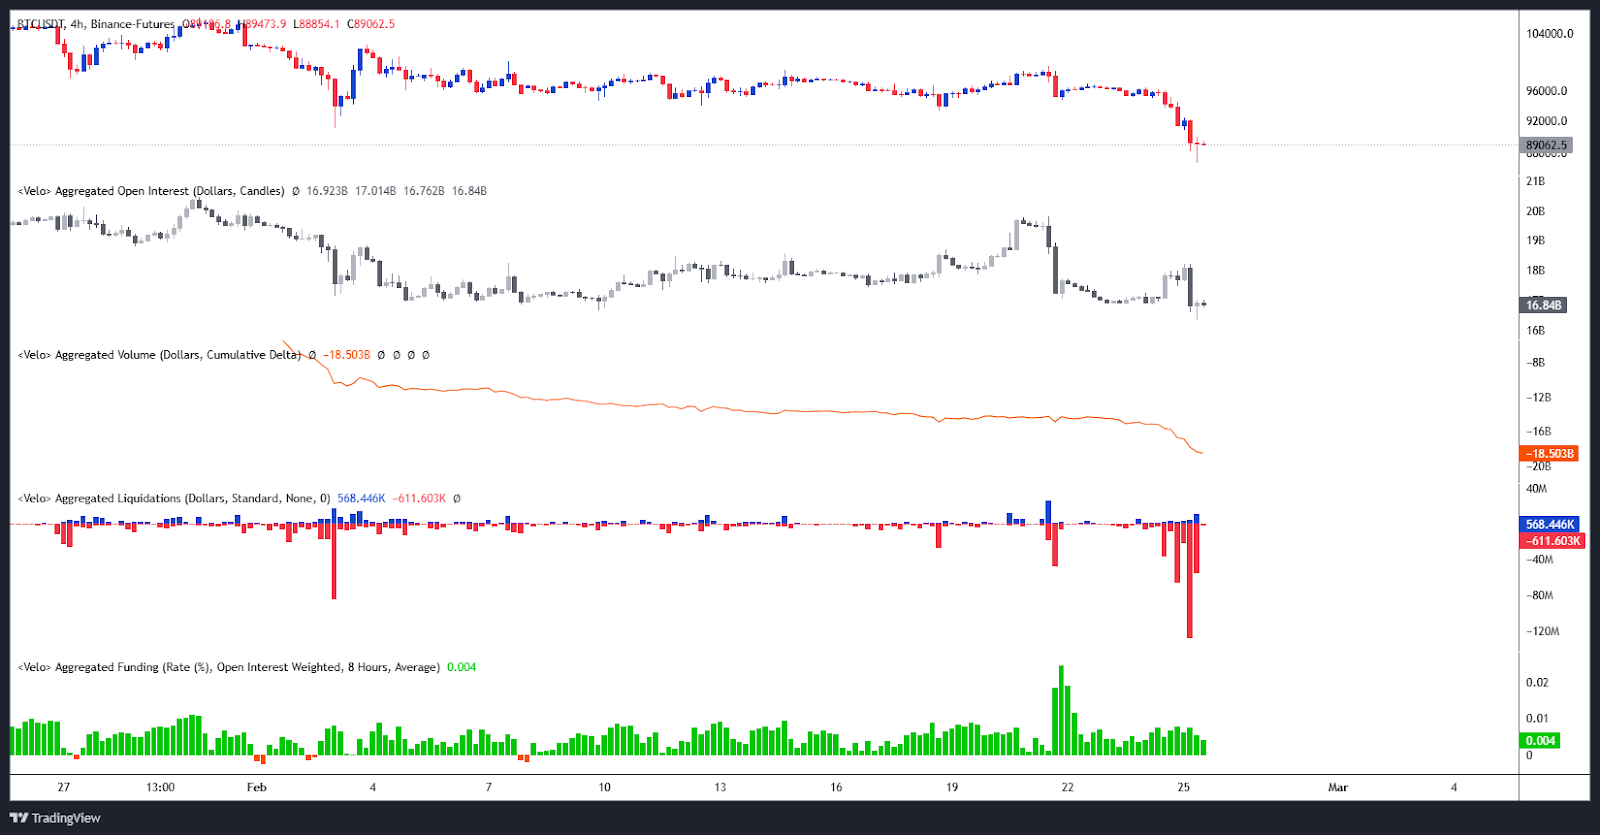
In recent weeks, we have observed simultaneous stabilization of open interest and the underlying course, signaling a phase of market consolidation. However, the downward recovery of the BTC has led to a drop in open interest, suggesting a gradual output of positions on the perpetual BTC/USDT contracts.
Unfortunately, the drop in the CVD has accelerated again, reflecting a predominance of sellers on the current market. This dynamic suggests a renewed aggressiveness of the sellers, illustrating a significant sales intention on the part of investors.
The drop in Bitcoin has led to the largest liquidations of buying positions since the start of 2025, with almost $ 331 million liquidated in just two days. This wave of liquidations reflects strong selling pressure and increased volatility on the market, weakening the buying force. However, the funding rate of BTC/USDT contracts remains slightly positive, reflecting buyers' resilience despite the selling pressure.
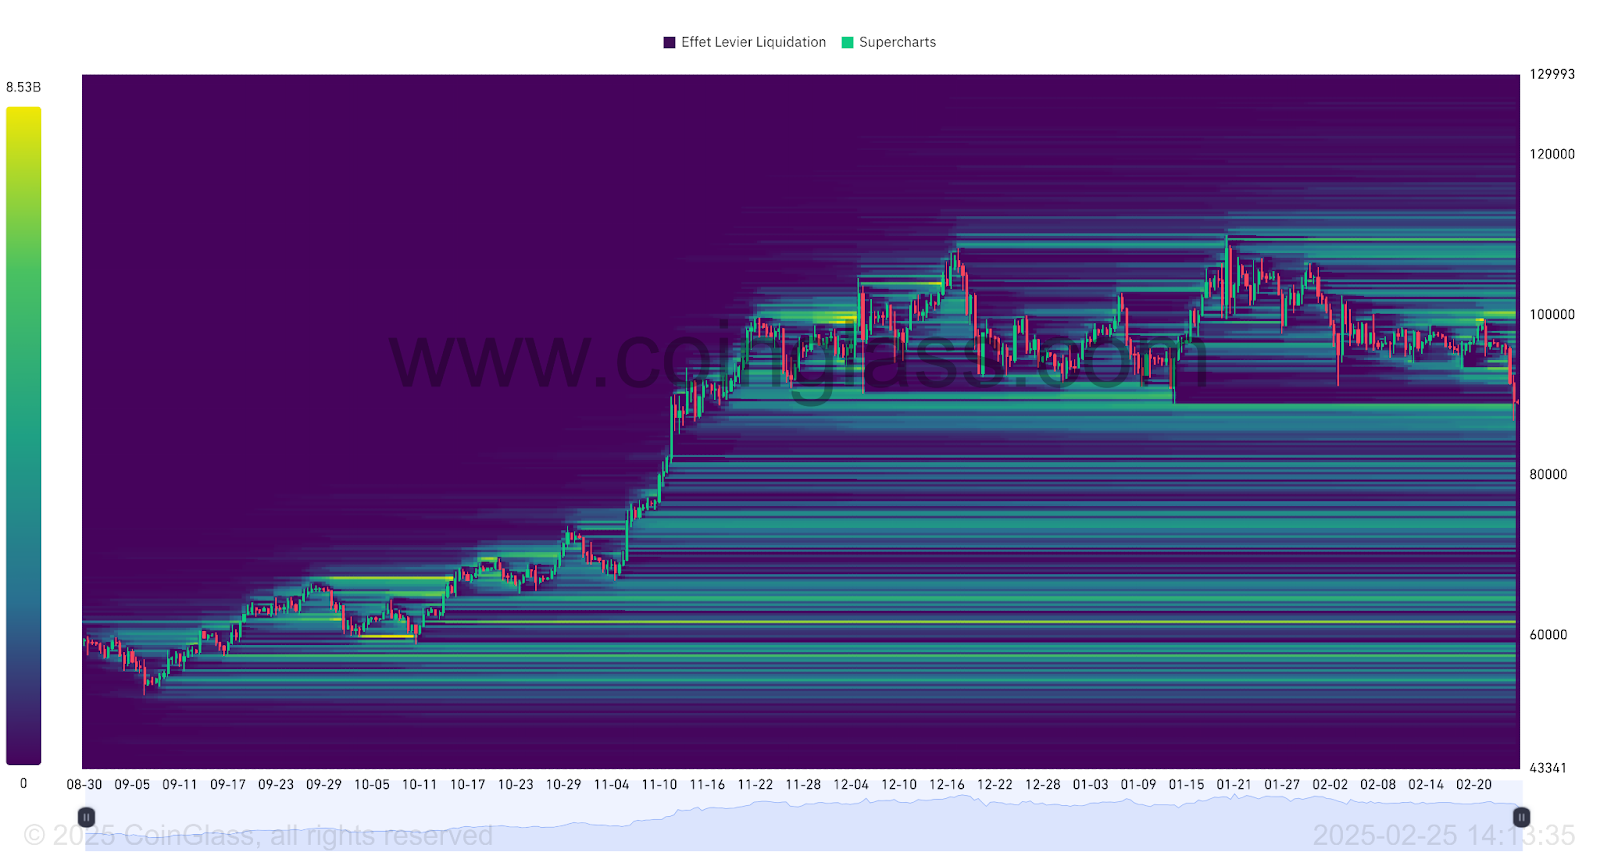
The Liquidation Thermal Card of Perpetual BTC/USDT contracts reveals that Bitcoin has reached a major liquidation zone, identified around $ 88,000. A buyer interest seems to have manifested itself, as evidenced by the sudden rebound in the price in contact with this level.
Now, key liquidation zones are on both sides of the current course.
- Above, a first liquidation area is identified between $ 97,000 and $ 98,000, followed by a larger area around $ 100,000. The latter extends up to $ 104,000 and precedes another area between $ 107,000 and $ 111,000.
- Below, the last reached liquidation zone covers $ 84,500. Further down, another area is located around $ 80,000, followed by a more marked area around $ 74,000.
These thresholds constitute major inflection points for the market. An approach to the price to these levels could lead to the massive activation of orders, thus playing a key role in the next movements, depending on the dynamics of supply and demand.
Forecasts for the Bitcoin course (BTC)
- If Bitcoin manages to maintain itself above $ 86,800, a recovery could allow it to reintegrate the $ 90,700, thus opening the way to the resistance of $ 99,400. Overcoming this threshold could then promote a return to $ 106,000, then to its ATH at $ 109,354, an increase of around 22 %.
- Conversely, if Bitcoin fails to maintain itself above $ 86,800, it could find a support around $ 85,000. A prolonged decrease would then bring its price to the threshold of $ 81,700, or even $ 78,500. Finally, the break of this level could lead to a new fall to the $ 76,000 zone, representing a drop of approximately 15 %.
Conclusion
Bitcoin shows signs of weakness with persistent selling pressure. Its upward dynamics run out of steam, giving way to a phase of uncertainty where buyers struggle to regain control. As long as the key levels are not reconquered, the risk of pursuit of the decline remains present. In this context, it will be essential to closely monitor the reaction of prices at strategic levels in order to confirm or adjust current forecasts.
Finally, remember that these analyzes are based solely on technical criteria, and that the course of cryptocurrencies can evolve quickly according to other more fundamental factors.
Has this study interested you? Find our latest XRP analysis.
Maximize your Cointribne experience with our 'Read to Earn' program! For each article you read, earn points and access exclusive rewards. Sign up now and start accumulating advantages.