Solana closes a positive week for the fourth time in a row. Let’s see the future prospects for the SOL price.
Location of Solana (SOL)
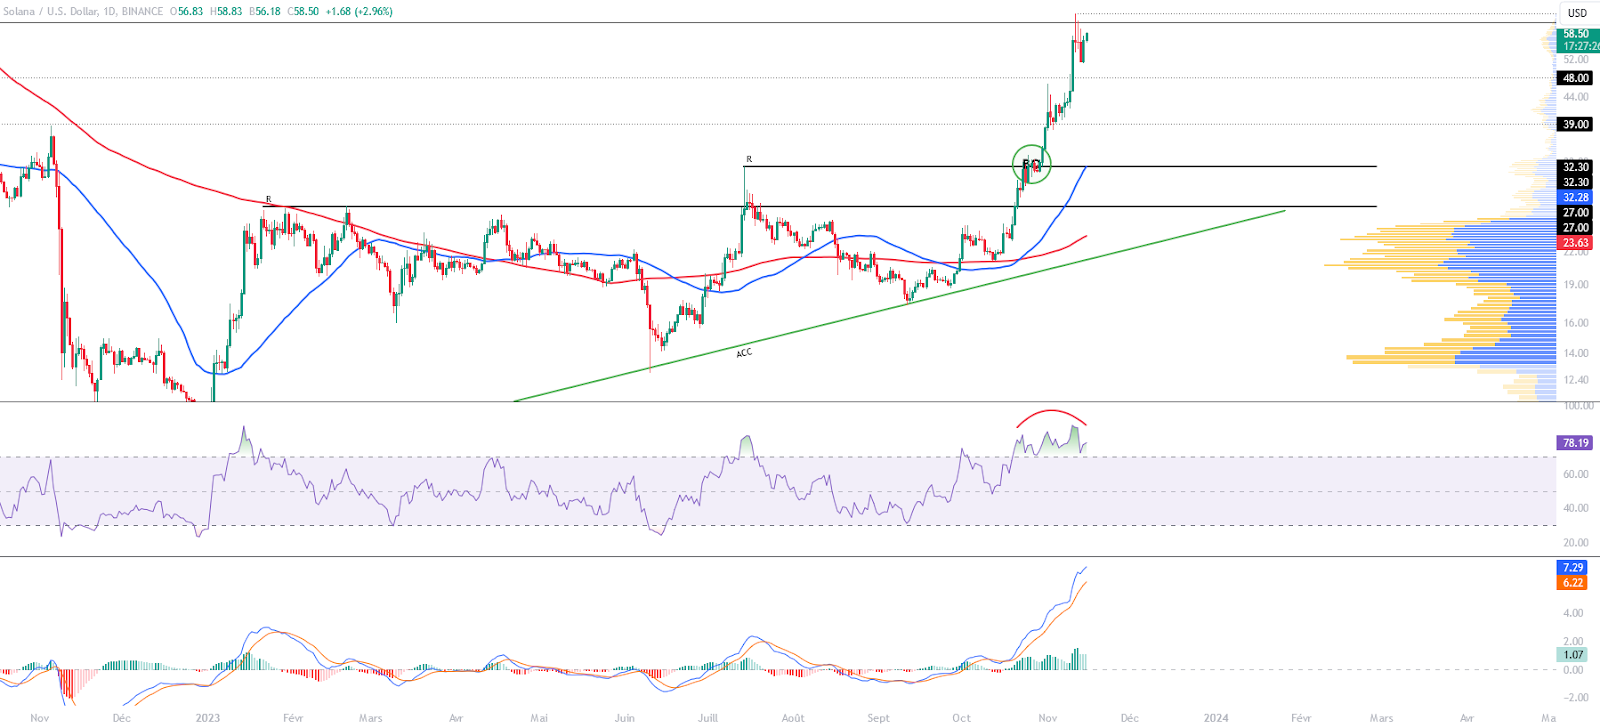
Over the past two weeks, the Solana price has seen a significant rise, with a remarkable increase of almost 94%. This performance propelled SOL to a new yearly high, reaching $64. This development confirms and largely exceeds the bullish hypothesis expressed in our analysis of October 26. The key levels identified in this previous analysis generated moderate reactions in the market, thus highlighting their relevance.
Currently, Solana is holding firmly above its 50-day and 200-day moving averages, signaling a clear uptrend. However, despite this positive trend, market volatility requires a cautious approach. Technical indicators, notably oscillators, still reveal bullish momentum. However, the daily RSI flattens and begins to diverge. This situation suggests a possible overbought Solana, which could foreshadow a correction or a period of consolidation to come.
The current technical analysis was carried out in collaboration with Elie FT, a passionate investor and trader in the cryptocurrency market. Today trainer at Family Tradinga community of thousands of own-account traders active since 2017. You will find Lives, educational content and mutual assistance around the financial markets in a professional and warm atmosphere.
Focus on Solana derivatives (SOLUSDT)
Over the last fortnight, we have observed an increase in Open Interest on Solana, alongside its price appreciation. This period saw Open Interest more than double, with a notable injection of over $370 million in additional positions (Long/Short). This development suggests increased appeal for Solana, mainly on the buyer side. However, a stabilization of the latter can be observed recently, which can be interpreted as a sign of uncertainty among investors, potentially reflecting a hesitation regarding the continuation of the upward momentum of the SOL.
Regarding liquidations, it is relevant to note that the majority of them concern short positions. However, it is important to emphasize that these liquidations are not significantly greater in number compared to the liquidations of long positions, which makes it difficult to draw a coherent conclusion.

According to the Solana Liquidation Heat Map, the current price of the cryptocurrency has significantly moved away from areas of high liquidity. The closest liquidation clusters are located below Solana’s current price, with an identifiable concentration around $40. As the market approaches these levels, this could trigger a large number of orders. As a result, this scenario may increase the volatility of SOL. This zone, through its ability to strongly influence price movements, therefore becomes a major point of interest for investors.

Assumptions for the price of Solana (SOL)
If the price of Solana breaks $64, we could anticipate a bullish continuation up to $80. The next resistance to take into account, if the upward movement continues, would be the threshold of $100 or even $115. At this stage, this would represent an increase close to +101%.
If the Solana price fails to hold above $48, we could consider a return to $39. The next support to take into account, if the bearish movement continues, would be around $32 and $27. At this point, that would represent a drop close to -52%.
Conclusion
Solana continued its rise by outperforming the crypto market. This dynamic confirms the solidity of its current bullish structure. This reflects strong investor confidence in Solana’s potential. However, a correction after such a rise seems likely and potentially as marked as the previous rise. Thus, this perspective requires increased vigilance. It will be important to carefully observe the price reaction on the different levels identified to confirm and refute the different hypotheses made. Beware of potential “fake out” and “market squeeze” in each situation. Additionally, it should be remembered that these scenarios are based solely on technical analysis. The price of cryptocurrencies may change more or less quickly, depending on other more fundamental factors.
Receive a summary of the news in the world of cryptocurrencies by subscribing to our new service daily and weekly so you don’t miss anything of the Tremplin.io essentials!