
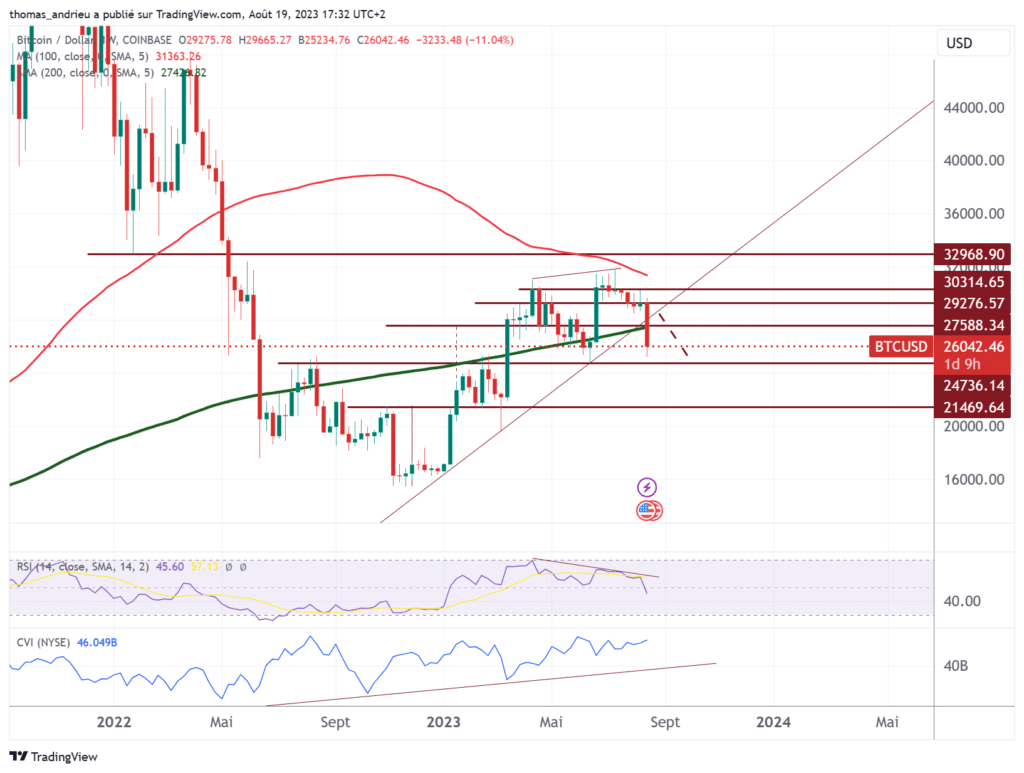
During the week of August 14, the price of bitcoin fell by almost 12%. A reversal all the greater as major thresholds, which could inspire confidence in the long term, have been broken. The price of bitcoin thus entered below the $26,000 zone. It had however stabilized beyond since March 2023. In our previous analysis of July, we showed that “The area around $26,000 appears to be a major zone as of today, and the lack of a recovery in volatility on traditional indices will likely determine further movement”.
The factors that heralded the fall
A month ago, we showed that “August and September can be months of stagnation and correction. We will therefore be particularly vigilant that the end of the summer does not put an end to the trend observed since January”. Thus, the seasonality and the greater weakness of the trend prompted us to be cautious. Even so, market activity in July 2023 was significant.
“Consequently, the price trend of bitcoin (BTC) could diverge from what has actually been observed since January 2023. We have seen that several elements indicate that a passage of bitcoin below $26,000, and more permanently below $25,000, could lead to a break in the trend towards $21,000 or $20,000. It is advisable, under these conditions, to ensure that the buying force is well supported during the summer of 2023. Otherwise, this would reduce the upside potential for the coming months. »
Bitcoin (BTC) struggles to break above $30,000 – Tremplin.io
The major challenge for bitcoin now is to hold itself above the $25,000 and $26,000 level. Otherwise, we would see a stronger bearish signal. Additionally, the 200-week moving average stands at over $27,000. Without a return to this level, the downside risk in the medium term is necessarily higher. Indeed, this moving average has never been permanently crossed downwards since 2015 at least. The sustained stagnation of bitcoin around $30,000 in recent weeks prompted great caution. But the hypothesis of lateralization remains the clearest.
How strong is the bitcoin (BTC) trend?
First of all, it is important to note that the strength of the bullish variations has been decreasing since the start of the bullish movement in February 2023. Moreover, despite an attempted correction in June 2023, the market has partially regained buying strength. The correction of the past week clearly shows a weakening of the medium-term trend. We can say, with little doubt, that the uptrend initiated since January 2023 is broken.
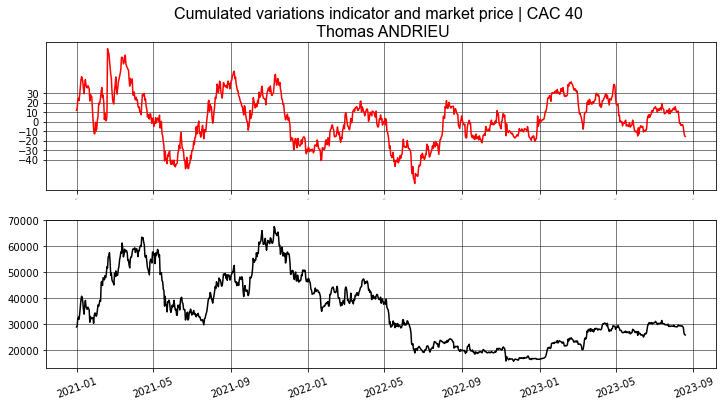
However, it is not clear that we are dealing with a downtrend, and above $25,000 to $26,000 we are sideways. This price level remains nearly 60% higher than that of January 1! It would take a 40% decline to retrace the major low of 2022.
A decline in all markets
To better understand whether the decline in BTC is a decline in itself, or a decline induced by other markets, we use the study of correlations. Over the past month, the correlation of bitcoin is very strong with all markets, except the dollar. Bitcoin is correlated at more than +60% with the price of gold or that of the CAC 40. Similarly, the correlation exceeds +70% in the case of the S&P 500.
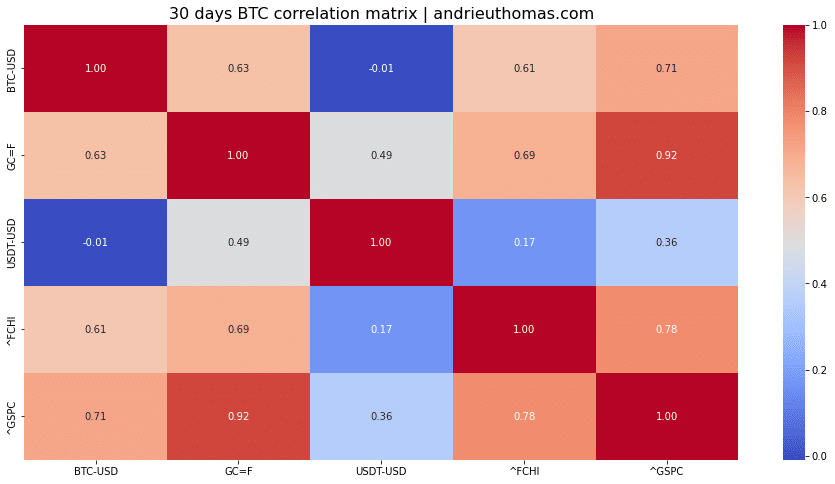
Indeed, it must be said that the week for stock market indices was particularly negative. The gold price fell over 7 days by nearly 1.2%. This brings the latter back to the major threshold of $1880 an ounce. Preserving the $1,800 appears to be a major issue. For its part, the S&P 500 lost almost 2.5%. Finally, the far global MSCI World index lost nearly 2%. It is therefore clear that the price of bitcoin therefore reacts by mechanical effect to other markets. Operators seem to be liquidating some of their positions in the market.
Fractals Show Reluctance
The study of fractals, however, shows a more interesting reading. As a reminder, fractals measure the degree of persistence of a trend. In the case of BTC, a high persistence of the trend often announces its end. Last month, it was possible to observe a potentially bullish signal. But the latter was overturned this month.
“The passage under the Hurst coefficient below the level of 0.7 constitutes a clear positive signal. It is equivalent to the signal observed in October 2020.”
Bitcoin (BTC) struggles to break above $30,000 – Tremplin.io
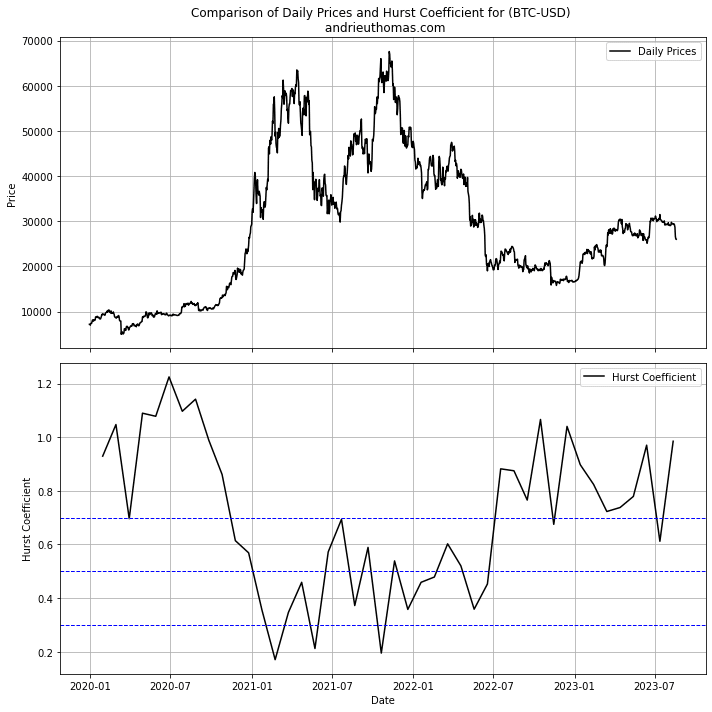
Nevertheless, it seems important to us to specify, from the point of view of fractals, that the potential for a new decline would be relatively smaller. Indeed, the persistence of the downward trend since 2022 remains. Consequently, the increase in the Hurst coefficient would above all reflect the persistence of a downward trend. But the violence of the fall indicates, as often, “anti-recurrence”. That is, the trend could stabilize quite abruptly.
Solid supports?
The question of whether this drop alone is enough to generate a bear market is not easy. However, several elements tend to show that, if the strength of the bull market is annihilated, the situation is still under control. Indeed, we will notice that the recent decline marked the bearish break of the trend observed since January. According to the principle of the pendulum, a first technical target for this breakout would be located around $25,300, which effectively corresponds to the latest low at the moment.
We are simply recalling the fact that a bitcoin held above $25,000 is still in a decent situation. Moreover, the drop in bitcoin is not accompanied (for the time being) by a drop in the cumulative volume index (volumes proportionate to the variation of the period). IIt follows that the market is not in a bearish abyss, although we are witnessing the validation of a bearish quasi-divergence since May.
Index volatility at work
We know that extremes in the market are often synonymous with movements in volatility. Indeed, market lows are often accompanied by a minimum of correlation with index volatility. Additionally, major bitcoin highs are often driven by low volatility. This is probably what we are witnessing today.
The S&P 500 Volatility Index (VIX) alone has climbed +35% since the end of July. We therefore understand that the return of volatility on the markets is probably the reason for such a fall. The movements of bitcoin would have to be independent of the instability of the indices to probably announce an upward reversal. But for the time being, any instability in the indices will be harmful to cryptocurrency prices.
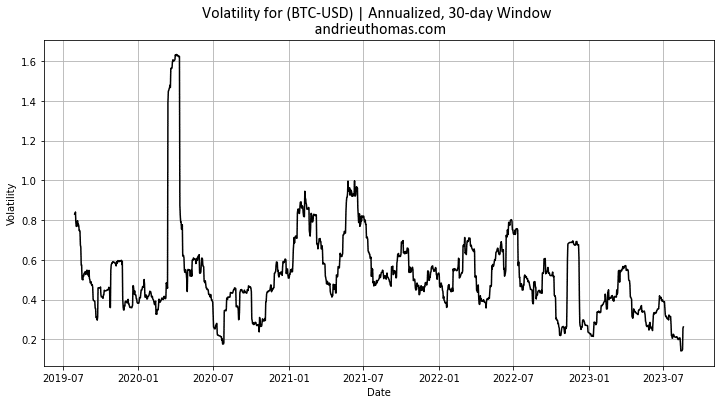
It is also remarkable that the volatility of bitcoin is historically low! The historical 30-day volatility of BTC stands at almost 25%, which is absolutely comparable to stock indices. Low bitcoin volatility often limits downside potential, as rising bitcoin often begets rising volatility. The fact that the volatility of bitcoin goes up at the same time as its fall is also an abnormal element.
In conclusion
Ultimately, we showed that bitcoin’s surprising drop could be framed. The major zone therefore remains that of $25,000 to $26,000. It is clear that the uptrend present since January 2023 is broken. This fall is mainly explained by the drop in the stock market indices, the return of instability on the latter, and the mechanics of liquidations. The sudden nature of this movement could lead to setbacks, but nothing is certain at this stage. Moreover, the situation is not yet critical. The appeal remains in terms of volumes, volatility, and trend persistence. But it is clear that this movement induces doubt among investors who might have seemed too optimistic. The difficulty in crossing the $30,000 area in recent weeks has confirmed, in addition to statistical exhaustion, the reversal of the market. Entering a sideways market is therefore subject to two options. The seasonality of September prompts us to be cautious, although nothing is very alarmist at the moment.
Receive a digest of news in the world of cryptocurrencies by subscribing to our new service of daily and weekly so you don’t miss any of the essential Tremplin.io!