After reaching a new summit, Litecoin has entered a consolidation phase, revealing a possible continuation of the trend. Discover Elyfe's analysis to decipher the technical perspectives of the LTC.

Litecoin course situation (LTC)
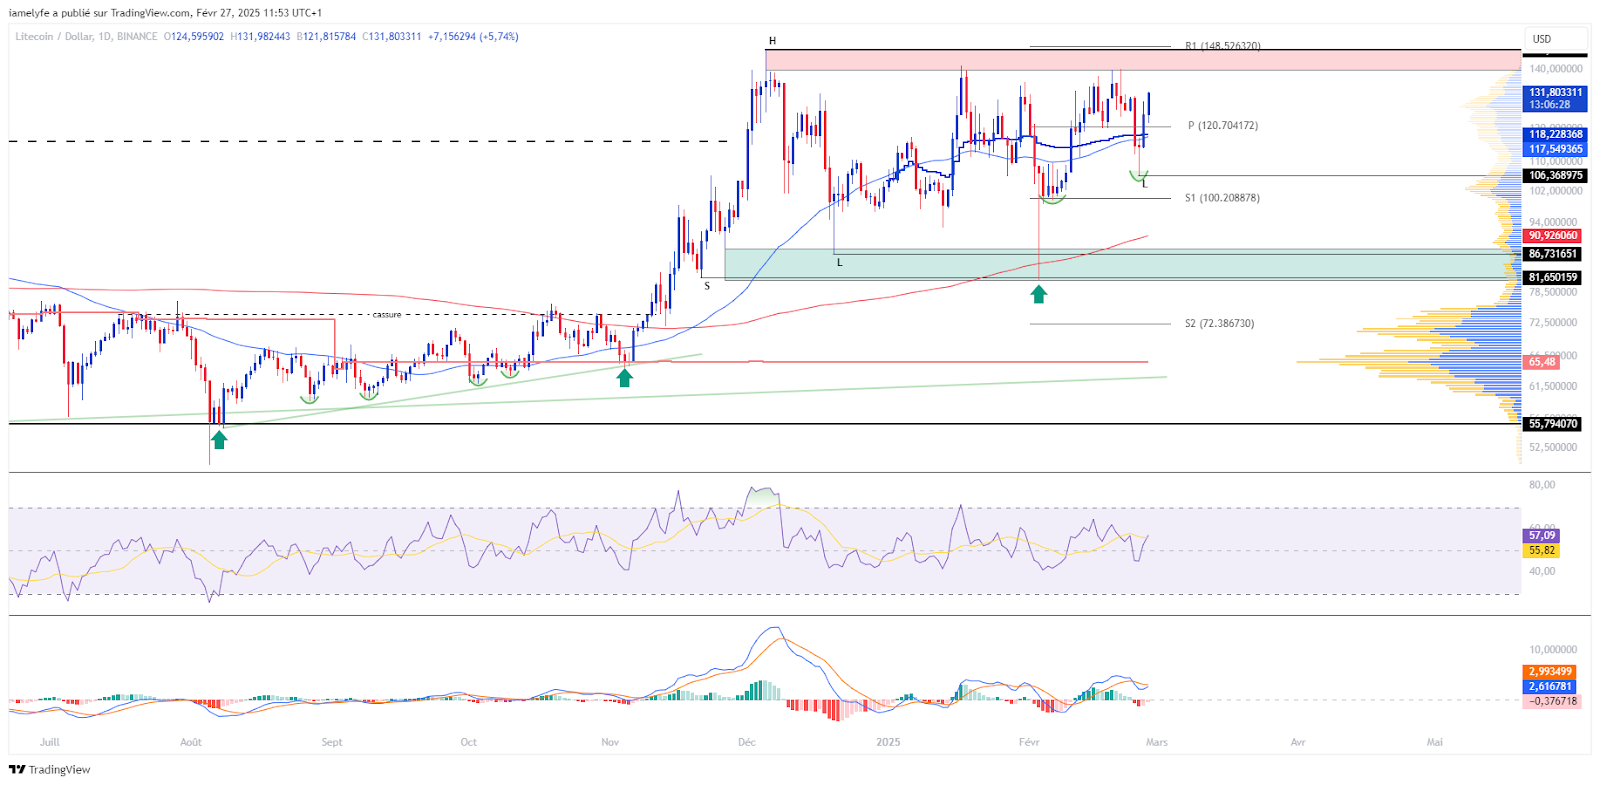
After consolidating in the form of an ascending triangle on the support of $ 55.8, the Litecoin price aroused buyer interest, propeling its price by around 125 %. The LTC thus reached $ 147, validating the crossing of the resistance of $ 116.
Unfortunately, this level led to a decline in the course, testifying to the emergence of a selling pressure. Since then, Litecoin has been evolving in a range phase, fluctuating overall between $ 82 and $ 142.
At the time of writing, Litecoin evolves in the upper part of its range, precisely around $ 131. It is positioned above its mobile average at 50 days, which coincides with its annual VWAP. Although the short -term trend seems to start upwards, the medium -term trend remains neutral. On the other hand, the long -term trend remains upward, as evidenced by the still ascending orientation of the Mobile average at 200 days.
Unsurprisingly, the upper dynamic of the LTC has gradually weakened since its last impetus. This loss of momentum is reflected not only in the evolution of the price, but also in the oscillators. Nevertheless, a slight rebound is underway, suggesting a timid resumption of movement.
Current technical analysis was carried out in collaboration with Elyfeinvestor and popularizer in the cryptocurrency market.
Zoom on derivatives (LTC/USDT)
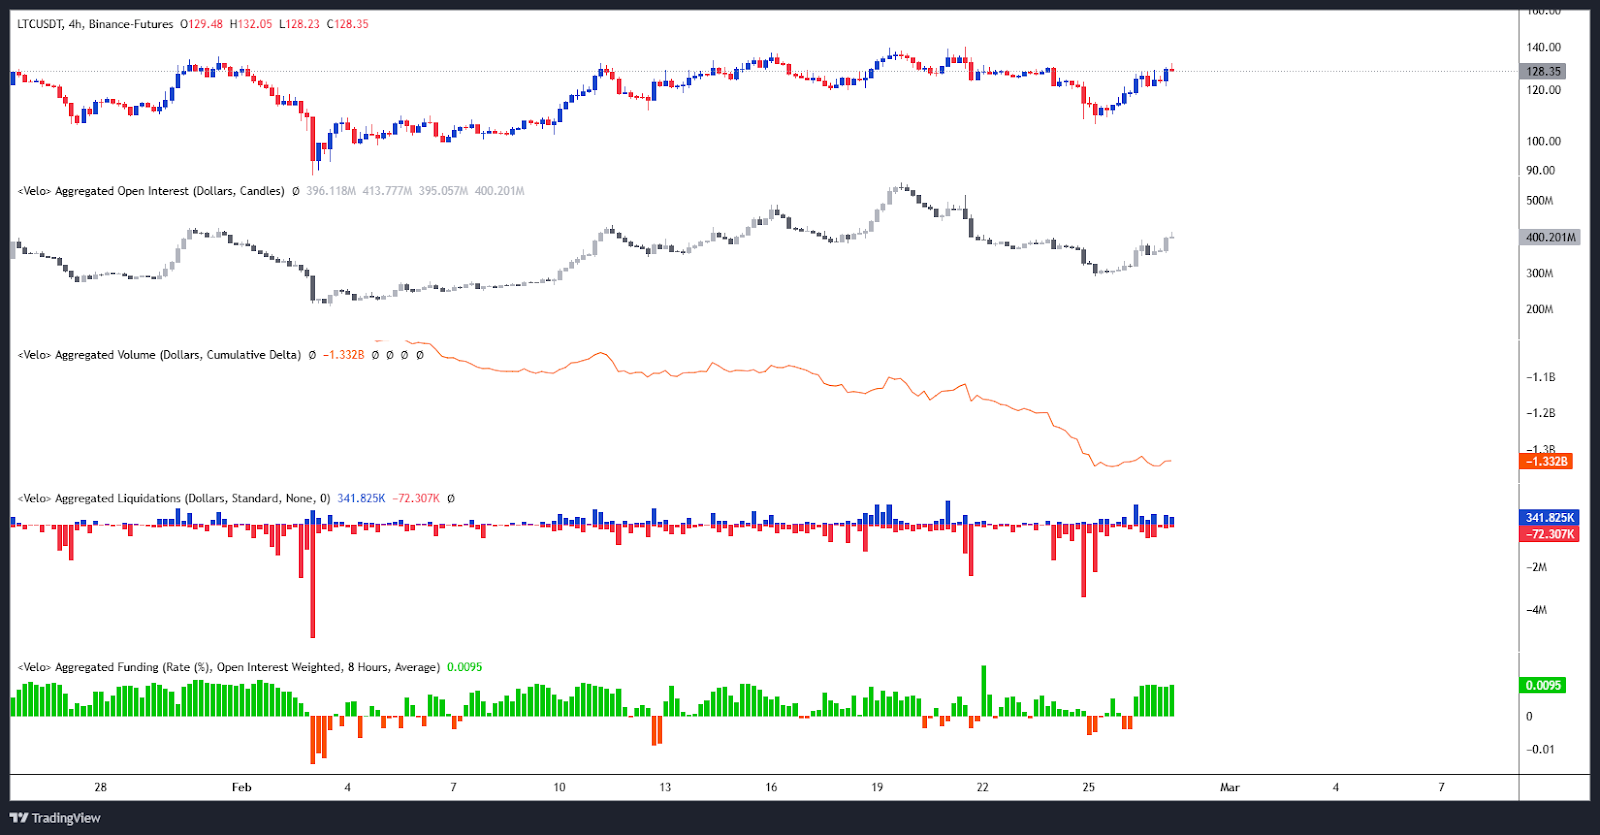
In recent weeks, we have observed a simultaneous increase in open interest and the underlying course, signaling growing interest in perpetual LTC/USDT contracts.
However, the last drop in Litecoin led to a decrease in open interest, suggesting a gradual liquidation of speculative positions. Although this movement may seem worrying, it seems to be reversed, indicating a new recovery in progress. This phenomenon is accompanied by positive financing rate, suggesting that the buying pressure remains present on the LTC/USDT contracts.
After stabilizing, the CVD has accelerated downwards, signaling a domination of the sellers on the market. This dynamic reflects increased aggressiveness of sellers, increasing the risk of continuing withdrawal in the absence of a reversal of buying flows. Fortunately for cryptocurrency, this trend seems to stabilize, suggesting a slowdown in selling pressure, which could announce a shortness of breath, or even a possible change of trend.
The drop in LTC led to slight liquidations of buying positions after the break of the $ 120 support. This movement translates increased selling pressure, weakening the buying dynamics in place.
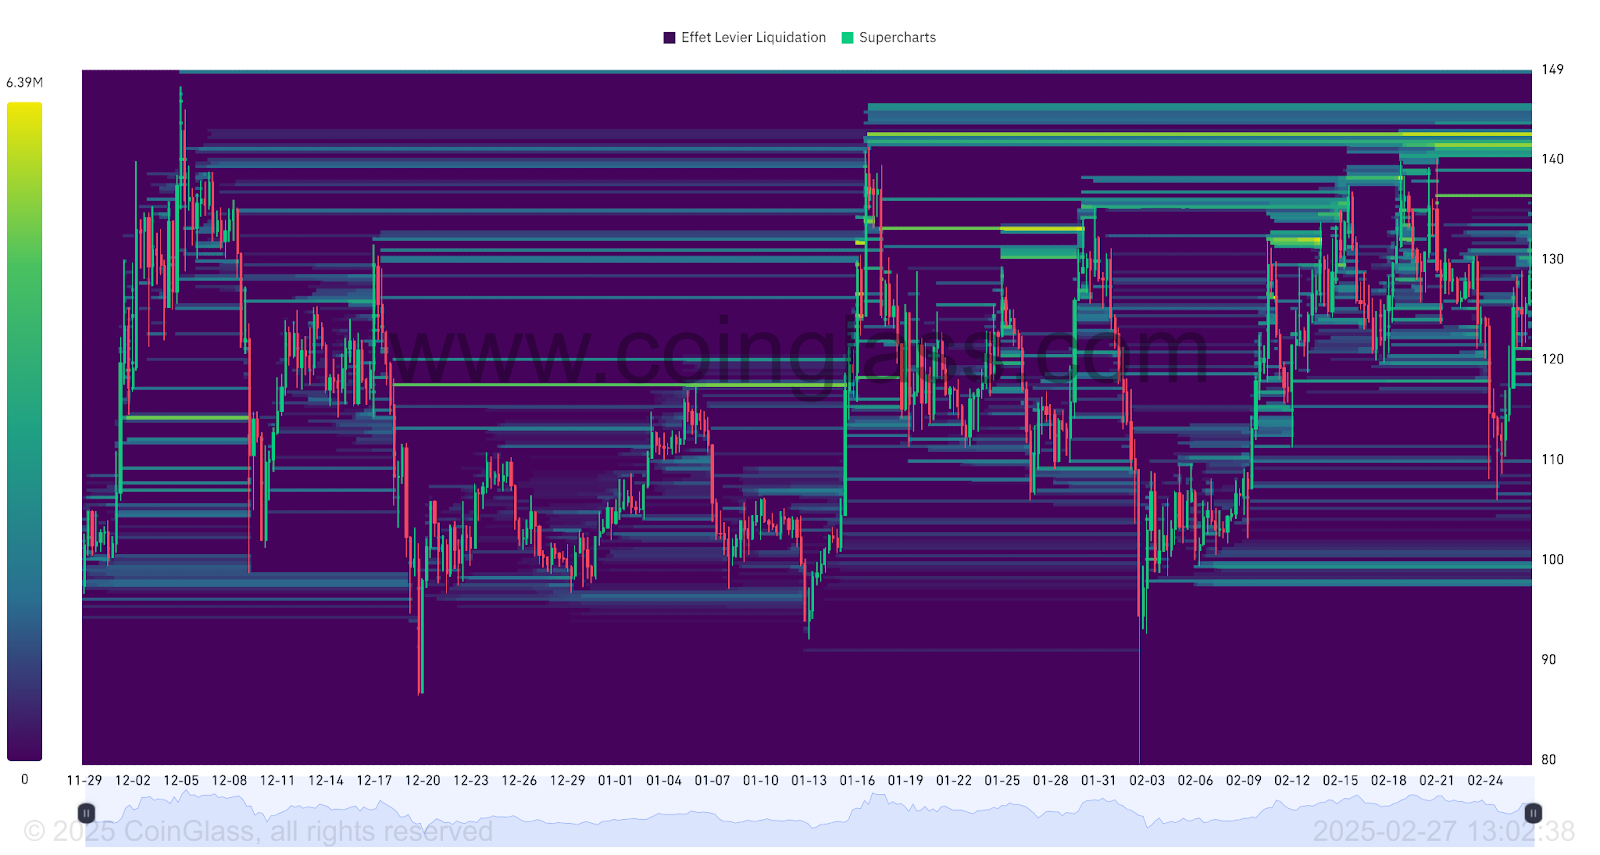
The LTTC/USDT perpetual contract thermal card the liquidation card reveals that cryptocurrency has just reached the $ 130 liquidation zone. It seems to stabilize around this level, without displaying orders with a significant impact on the price.
Now the key liquidation zones are on both sides of the current course:
- Above, a first liquidation zone is identified around $ 136, followed by a much larger area around $ 142. Even higher, the $ 150 area is a key level.
- Below, liquidations are less marked. There is a first area around $ 120, followed by more subtle liquidations below $ 110. Finally, a more marked area appears under $ 100.
These thresholds constitute major inflection points for the market. An approach to the price to these levels could lead to the massive activation of orders, thus playing a key role in the next movements, depending on the dynamics of supply and demand.
Forecasts for the Litecoin course (LTC)
- If Litecoin manages to maintain itself above the $ 106, a recovery could allow it to cross the resistance of $ 140, thus opening the way to its last summit at $ 147. Overcoming this threshold could trigger a new expansion, propelling its course around $ 170, $ 210 and beyond if demand intensifies, which would represent an increase of more than 60 %.
- Conversely, if Litecoin fails to preserve the $ 106 threshold, it could find a support around $ 100. A break at this level could cause new correction under $ 90, or even up to $ 81. This would correspond to a drop of around 38 %.
Conclusion
Litecoin evolves in a phase of hesitation after a sharp increase followed by a withdrawal. Despite a weakening of the dynamics, a rebound is underway, revealing a possible renewed buyer interest. Confirmation of a sustainable recovery will depend on the capacity of the market to maintain its momentum. Will the ETF Litecoin contribute to it? One thing is certain: it will be essential to closely monitor the reaction of prices at strategic levels in order to confirm or adjust current forecasts.
Finally, remember that these analyzes are based solely on technical criteria, and that the course of cryptocurrencies can evolve rapidly depending on other more fundamental factors.
Has this study interested you? Discover our latest analysis on the BNB now.
Maximize your Cointribne experience with our 'Read to Earn' program! For each article you read, earn points and access exclusive rewards. Sign up now and start accumulating advantages.