The second quarter of 2026 saw the cryptocurrency market continue its decline for a third consecutive quarter of decline, as bearish momentum culminated in a severe collapse in June. The total cryptocurrency market capitalization fell -12.6% ($304.8 billion) to end Q2 2026 at $2.1 trillion, its lowest point since September 2024 and approximately -52% below the October 2025 peak. The sharpest correction of the quarter occurred in June, amid a hawkish Fed stance, fluctuating U.S. tensions and Iran, and a token sale of Bitcoin by Strategy combined to trigger the biggest decline of the year.

Top 6 in CoinGecko’s Q2 2026 Crypto Industry Report
- Total crypto market capitalization fell -12.6% in Q2 2026, ending June at $2.1 trillion
- Stablecoin market capitalization slipped -1.6% to $305.1 billion, a first since Q3 2023
- Notional volume in prediction markets increased +48.7% quarter-over-quarter, totaling $113.8 billion in Q2 2026
- Collector Crypt has monopolized the tokenized collectibles space with a 62.8% share as of June 2026
- Spot trading volume on centralized exchanges fell -27.9% in Q2 2026 to $1.95 trillion, with May hitting a new monthly low of $0.6 trillion
- Perps trading volume on centralized exchanges fell -10.0% from $14.1 trillion in Q1 to $12.7 trillion in Q2
While Bitcoin (-14.2%) and Ethereum (-25.4%) continued to underperform even as U.S. stocks staged a strong rally, the quarter saw a sharp decoupling from traditional risk assets and a growing bifurcation between struggling major cryptocurrencies and pockets of speculative demand for altcoins, including Hyperliquid’s HYPE, which entered the top 10 thanks to new ETFs, prediction markets and a landmark deal with Coinbase.
OUR Crypto Industry Report Q2 2026 comprehensive covers everything from the crypto market landscape, to analysis of Bitcoin and Ethereum, to a deep dive into the decentralized finance ecosystem (Challenge) and a review of the performance of centralized exchanges (CEX) and decentralized exchanges (DEX).
1. Total crypto market capitalization fell -12.6% in Q2 2026, ending June at $2.1 trillion
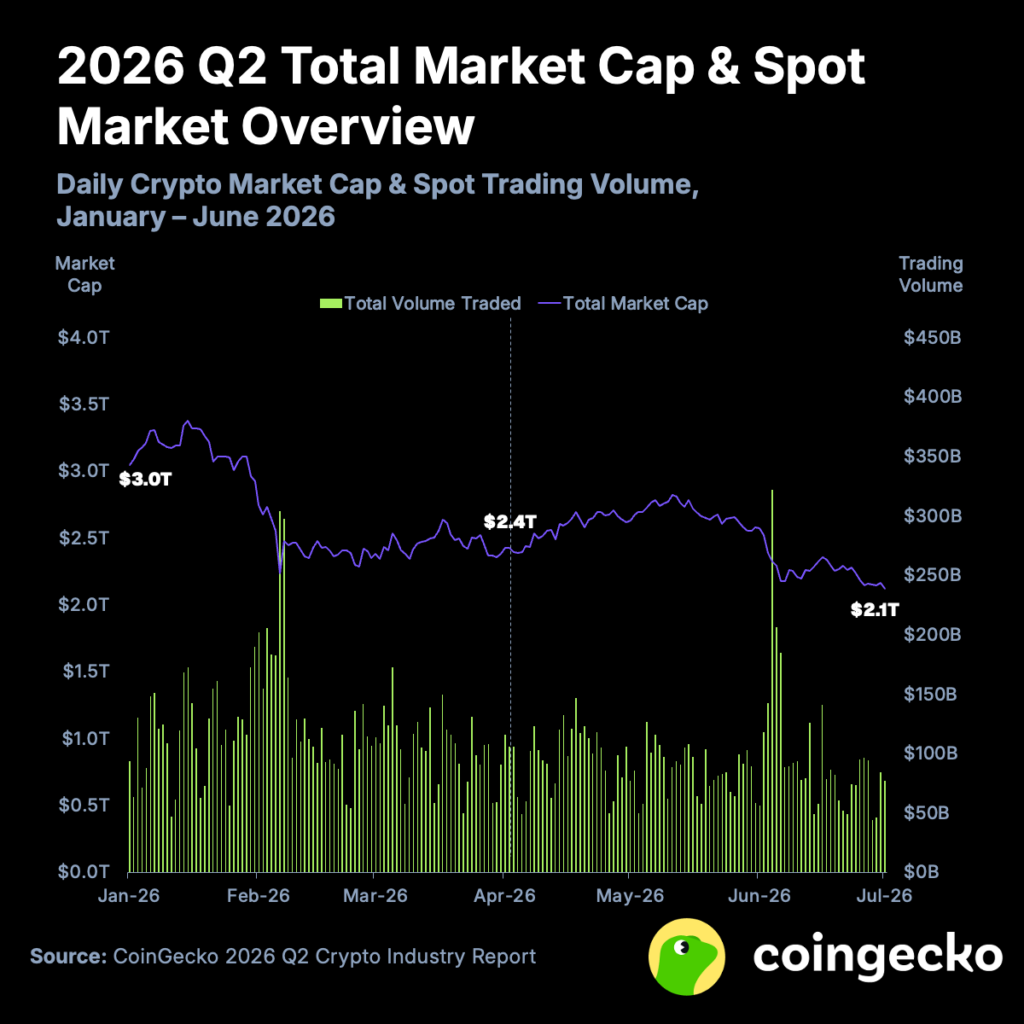
There total crypto market capitalization fell -12.6% in Q2 2026, from $2.4 trillion to $2.1 trillion. Unlike the frontal sell-off in Q1 2026, Q2 started on stronger footing, with April positioning itself as one of the strongest months of the year before a trend reversal. The declines in crypto asset prices were accompanied by a fall in the capitalization of stablecoins, a first since Q3 2023, a clear sign of a withdrawal of capital from the industry.
The most severe correction of the quarter occurred in June, amid increased ETF outflows, a hawkish Fed stance, fluctuating tensions between the United States and Iran, and a token sale of Bitcoin by Strategy. Total market capitalization was approximately 52% below the October 2025 peak at the end of Q2.
Trading activity continued to slow significantly for a second consecutive quarter, with average daily trading volume falling to $93.1 billion, a -20.9% quarter-over-quarter decline.
2. Stablecoin market capitalization slipped -1.6% to $305.1 billion, a first since Q3 2023
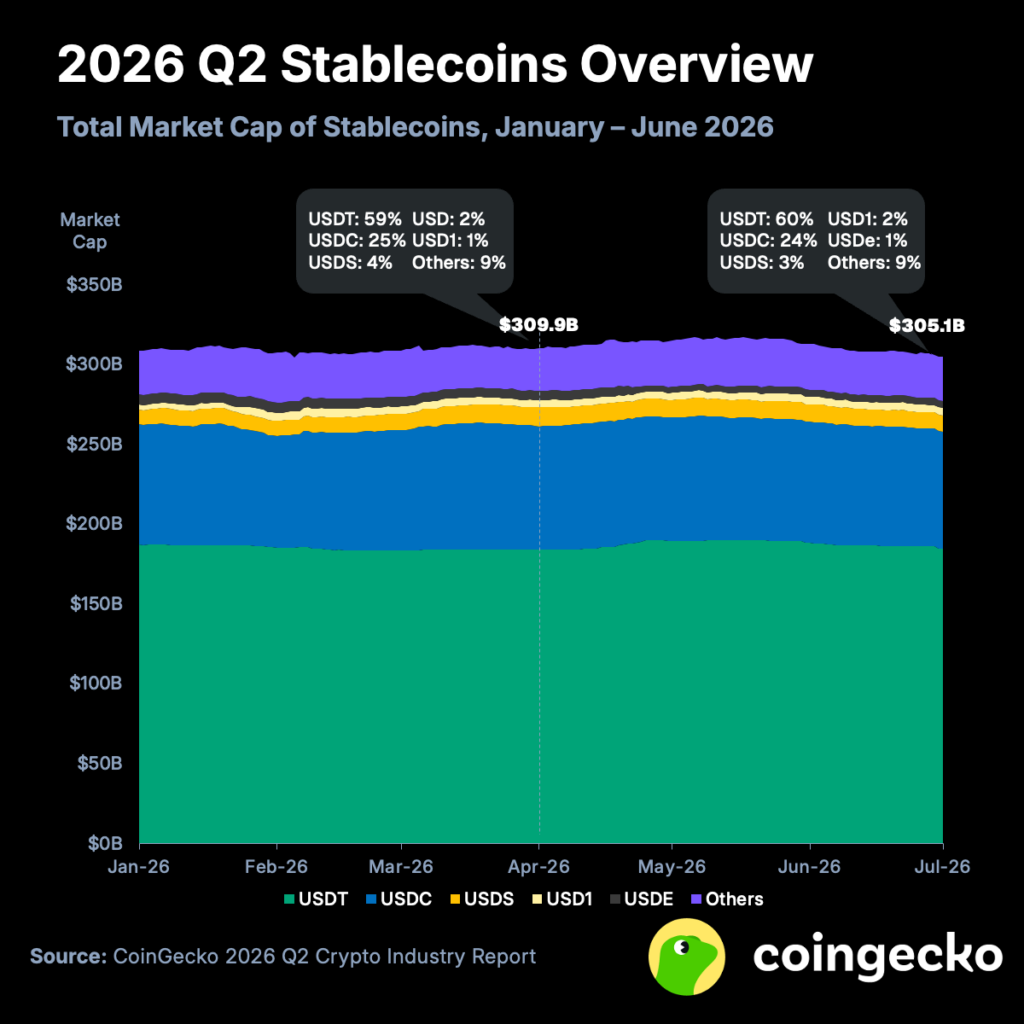
The total stablecoin sector declined by -$4.8 billion (-1.6%) in Q2 2026, ending the period at $305.1 billion, a reversal from the marginal growth seen in Q1, although the decline was small in comparison to the broader market decline.
Circle USDC (-4.8%; -$3.7 billion) saw the largest outflow in the sector in absolute terms, falling to $73.5 billion. In contrast, Tether’s USDT (USDT) (+0.2%; +$0.3 billion) remained roughly stable at 184.4 billion, recovering from its Q1 exit and increasing its market share to 60%.
Sky’s USDS (USDS) (-16.4%; -2.0 billion) sharply reversed its momentum from the previous quarter, falling to 10.0 billion, while Ethena’s USDe (-24.4%; -1.4 billion) resumed its contraction after a brief stabilization in Q1, ending the quarter at 4.4 billion. The decline was mainly due to a compression in yields falling below the risk-free rate, prompting sUSDS and sUSDe stakers to withdraw their stakes.
The USD1 of WLFI (USD1) (+5.5%; +0.2 billion) continued to grow at a more moderate pace than its strong increase in Q1, while the “Other” category (+6.2%; +1.7 billion) experienced a slight rebound.
3. Notional volume in prediction markets increased +46.0% quarter-over-quarter, totaling $111.7 billion in Q2 2026
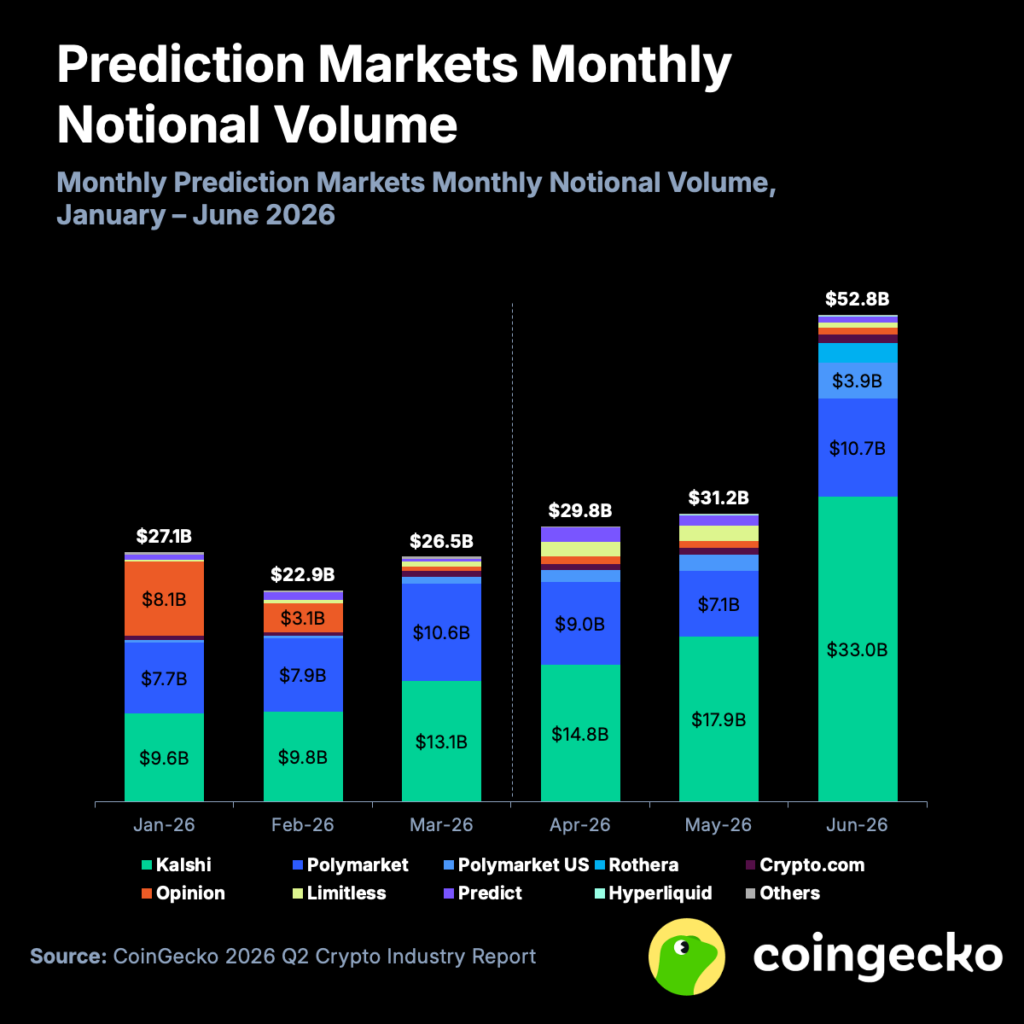
Notional volume in prediction markets totaled $113.8 billion in Q2 2026, a +48.7% quarter-over-quarter growth. June’s notional volume of 50.7 billion represented an increase of +91.9% compared to the average of the previous five months (27.5 billion), marking a new record. This has been due to a concentration of key sporting events since the end of May (UEFA Champions League Final, Stanley Cup, NBA Finals, FIFA World Cup, Wimbledon, etc.).
The growth is most evident on Polymarket, where sports contracts now dominate volumes (81% in June compared to 40% in January). In terms of market share, Kalshi increased its lead from 42.4% in Q1 to 58.9% in Q2. Meanwhile, Polymarket lost market share, dropping from 35.8% to 30.2% quarter-over-quarter.
Separately, Rothera, the Robinhood/Susquehanna International Group (SIG) joint venture launched in May, quickly climbed to fourth place in June, with notional volume of $2.1 billion.
4. Collector Crypt has monopolized the tokenized collectibles space with a 62.8% share as of June 2026
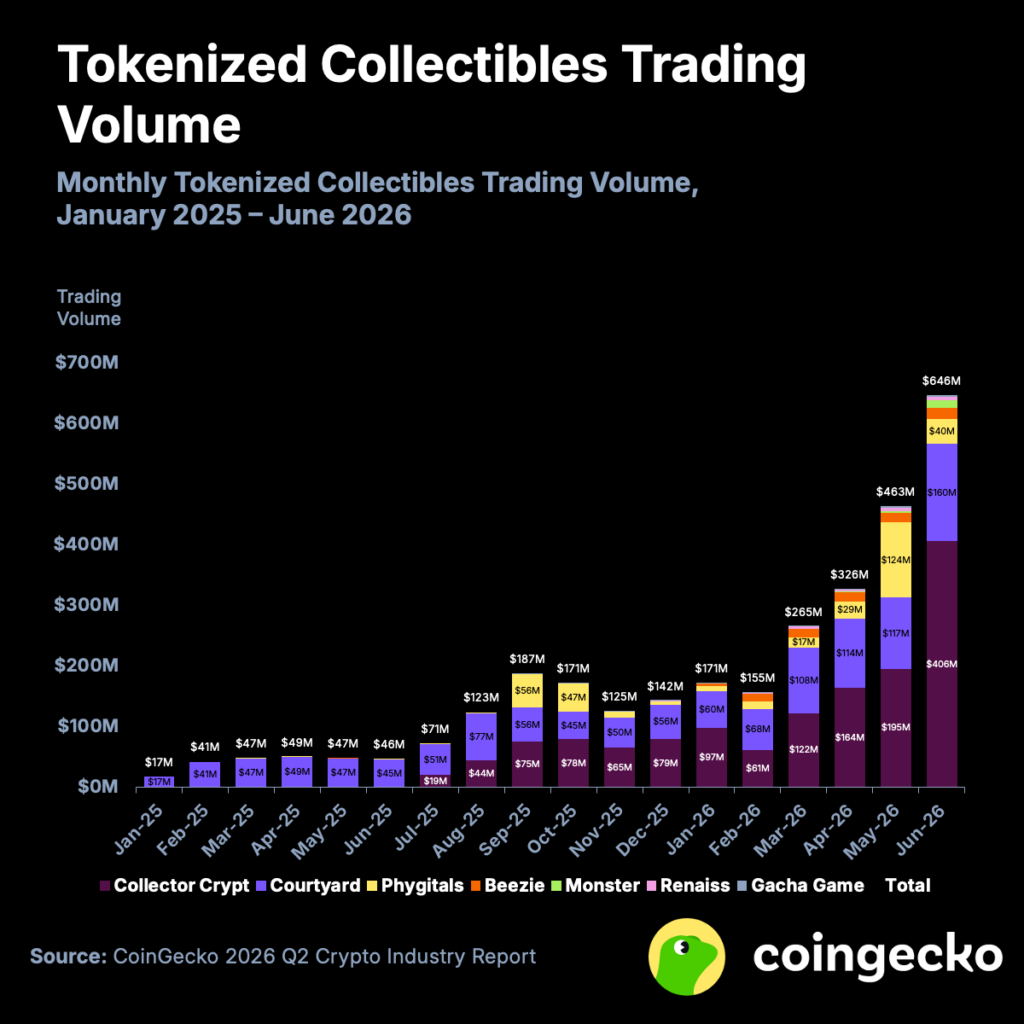
While the tokenized TCG space was largely monopolized by Courtyard in the first half of 2025, Collector Crypt has now overtaken it as the leading platform in 2026, recording a monthly volume increase of +317.0%, from $97 million in January 2026 to $406 million in June 2026. Collector Crypt is now the leader in the field with 62.8% volume share in June.
In comparison, OpenSea saw just $32.7 million in NFT sales in June 2026, making Collector Crypt, Courtyard, and Phygitals the largest NFT marketplaces by comparison.
However, most of the volumes on these platforms do not actually come from secondary sales but from “gacha” mechanisms. On average, more than 98% of a platform’s trading volume is generated by this feature, which allows users to purchase different tiers of random NFTs, each offering a chance to win rare cards.
5. Spot trading volume on centralized exchanges fell -27.9% in Q2 2026 to $1.95 trillion, May hitting a new monthly low of $0.6 trillion
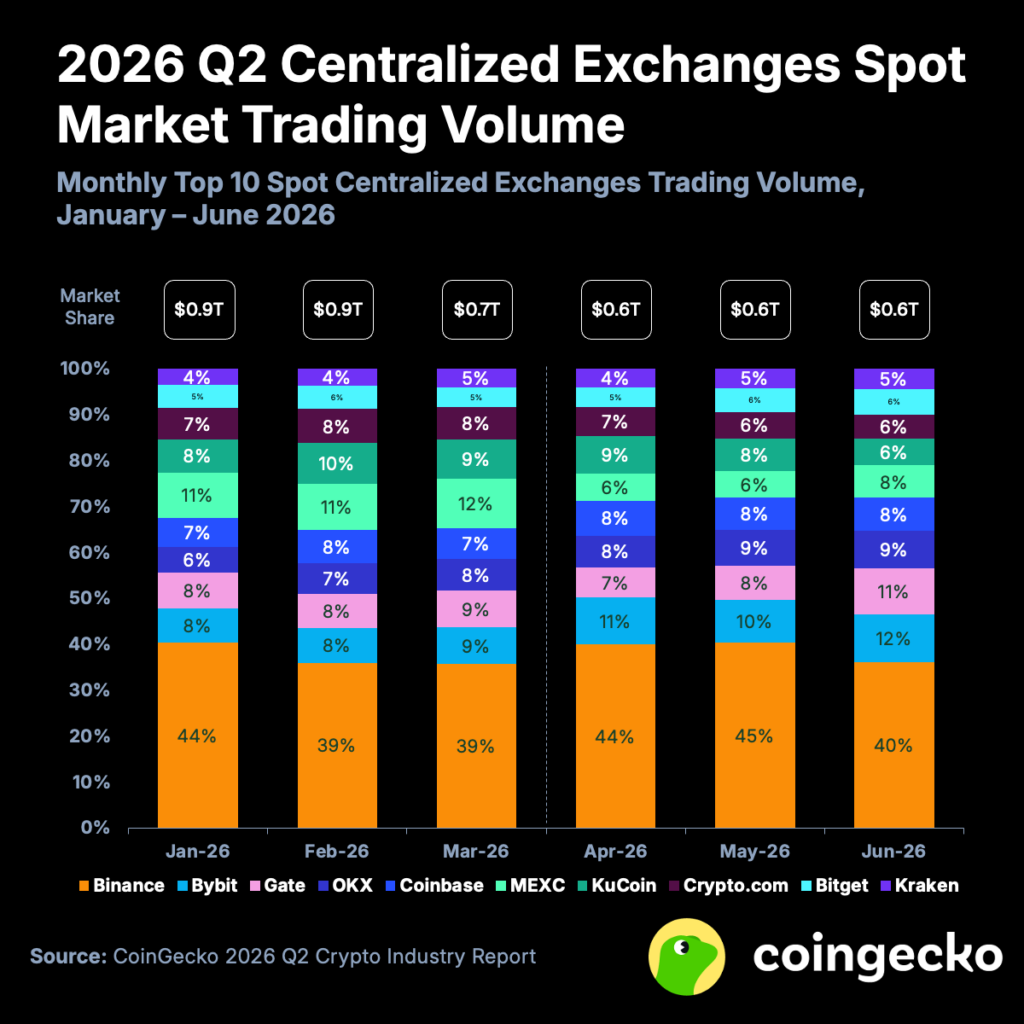
In Q1 2026, the top 10 centralized spot exchanges (CEXes spot) recorded a trading volume of $1.95 trillion, down -27.9% from $2.70 trillion in Q1 2026.
Volumes fell to a monthly low of 619.0 billion in May, before a slight rebound in June to 695.0 billion.
Despite the bear market, Binance expanded its dominance, with a 38.7% market share in Q2. He was joined by Bybit (10.0%) as the only other double-digit trade, having dethroned MEXC.
The declines were broad but uneven, ranging from -5% to –56%. MEXC saw the biggest drop, with volume more than halving from 275.2 billion to 121.2 billion, its position dropping from #2 to #7. Crypto.com and KuCoin also fell sharply, with declines of -40.9% and -38.5%, respectively.
6. Perps trading volume on centralized exchanges fell -10.0% from $14.1 trillion in Q1 to $12.7 trillion in Q2
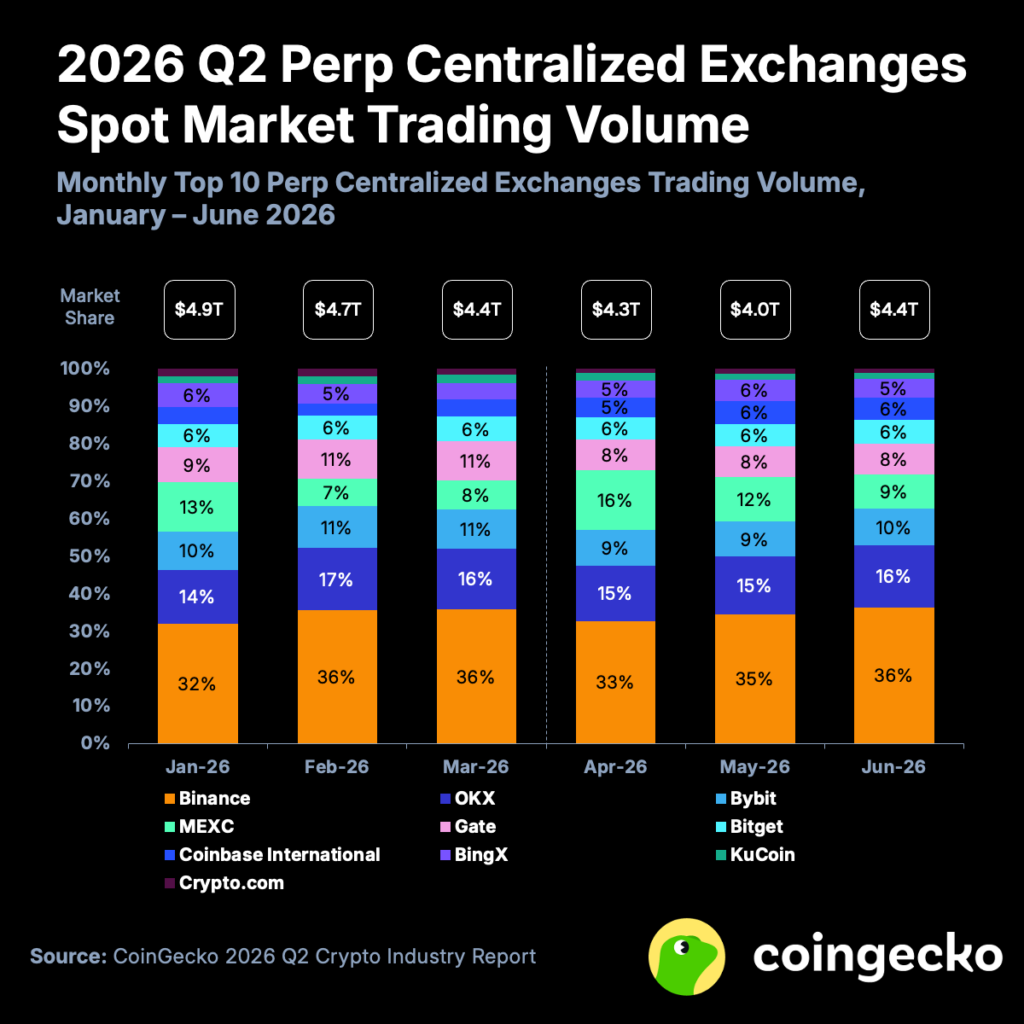
In Q2 2026, the top 10 centralized perpetual contract exchanges (Perp CEX) recorded $12.7 trillion, a -10.0% decrease from $14.1 trillion in Q1. Despite the overall decline, monthly trading volume remained above 4.0 trillion, still above the averages for the first three quarters of 2024.
Perps trading volume notably declined less sharply quarter-over-quarter compared to spot (-10.0% vs. -39.1%), reflecting traders’ preference for speculating in perps, while growth in RWA perps also helped maintain interest.
The trading volume also signaled broader market weakness. Despite the price recovery in May, volume fell to its lowest level of the year, while May volumes rebounded as BTC fell below $60,000.
The relative market share between the top 10 Perp CEXs remained largely unchanged. MEXC saw a brief spike in April and early May, but its gains declined in June.
Maximize your Tremplin.io experience with our ‘Read to Earn’ program! For every article you read, earn points and access exclusive rewards. Sign up now and start earning benefits.