Aptos has demonstrated bullish acceleration since its last plunge, rebounding more than 146% in two months. Let's look at the future prospects for the APT course.

Location of Aptos (APT)
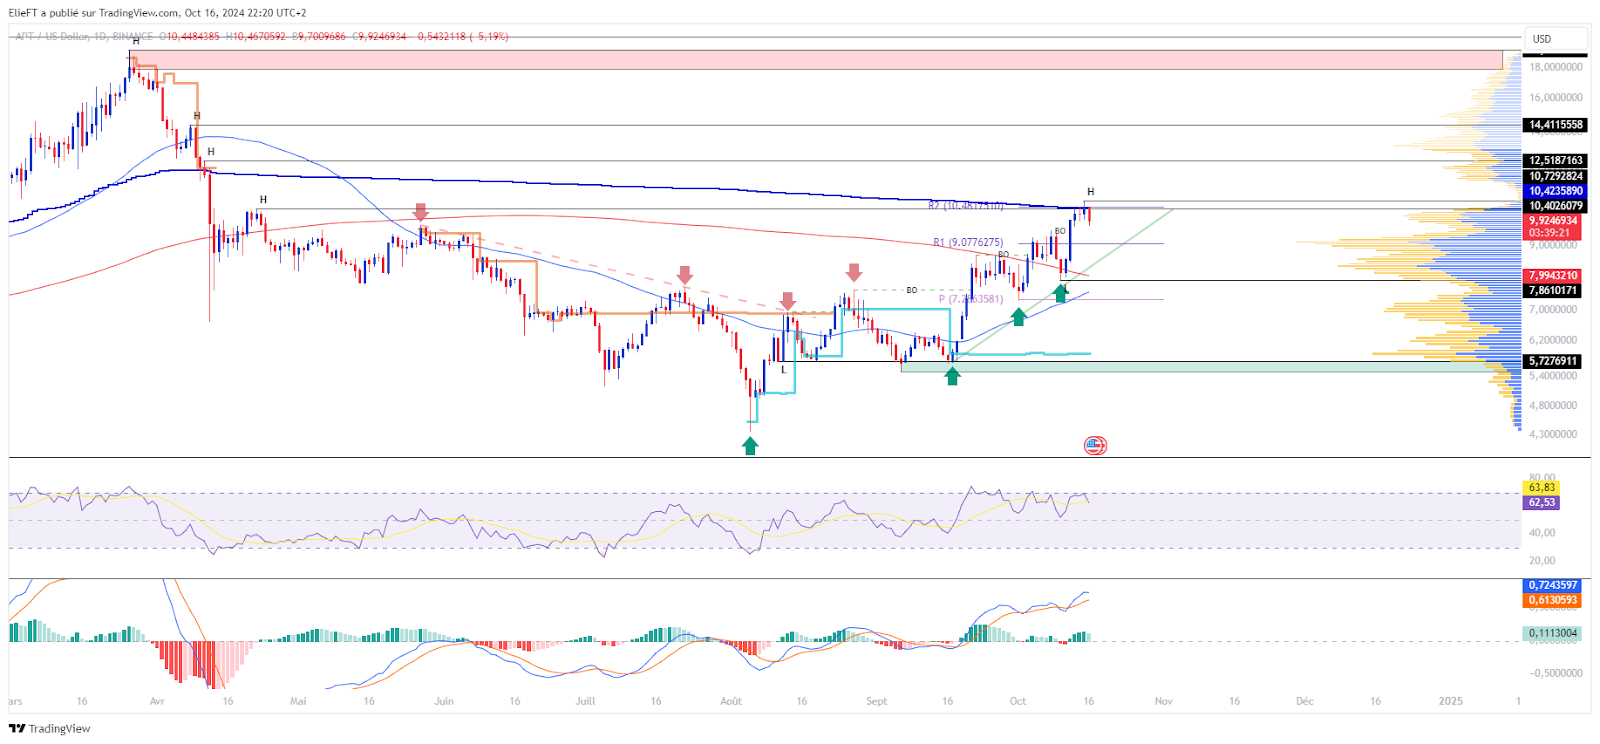
After dipping towards $4.36, Aptos rebounded to reach a new high around $7. The crypto then established a support zone around $5.5, which was tested several times. Additionally, it should be noted that this level was accompanied by a significant value zone, thus demonstrating its importance. APT then relied on this support to break through its resistance and reach new high points gradually.
At the time of writing, the price of Aptos is trading around $9.8. Its latest movements have thus enabled an upward reversal of the trend in the short and medium term. This observation is reinforced by the fact that the price of the crypto has exceeded its 50 and 200 day moving averages, which seem on the verge of forming a “golden cross”. Nevertheless, although everything seems favorable, it is worth noting that the crypto recently reached resistance located at the same level as the annual VWAP, which is near $10.40. Thus, this price level caused a slight drop in its price. As for Aptos's momentum, although it has pulled back slightly, it appears to be rising overall, as evidenced by its price and oscillators.
The current technical analysis was carried out in collaboration with Elie FT, a passionate investor and trader in the cryptocurrency market. Today trainer at Family Tradinga community of thousands of own-account traders active since 2017. You will find Lives, educational content and mutual assistance around the financial markets in a professional and warm atmosphere.
Focus on Aptos derivatives (APT/USDT)
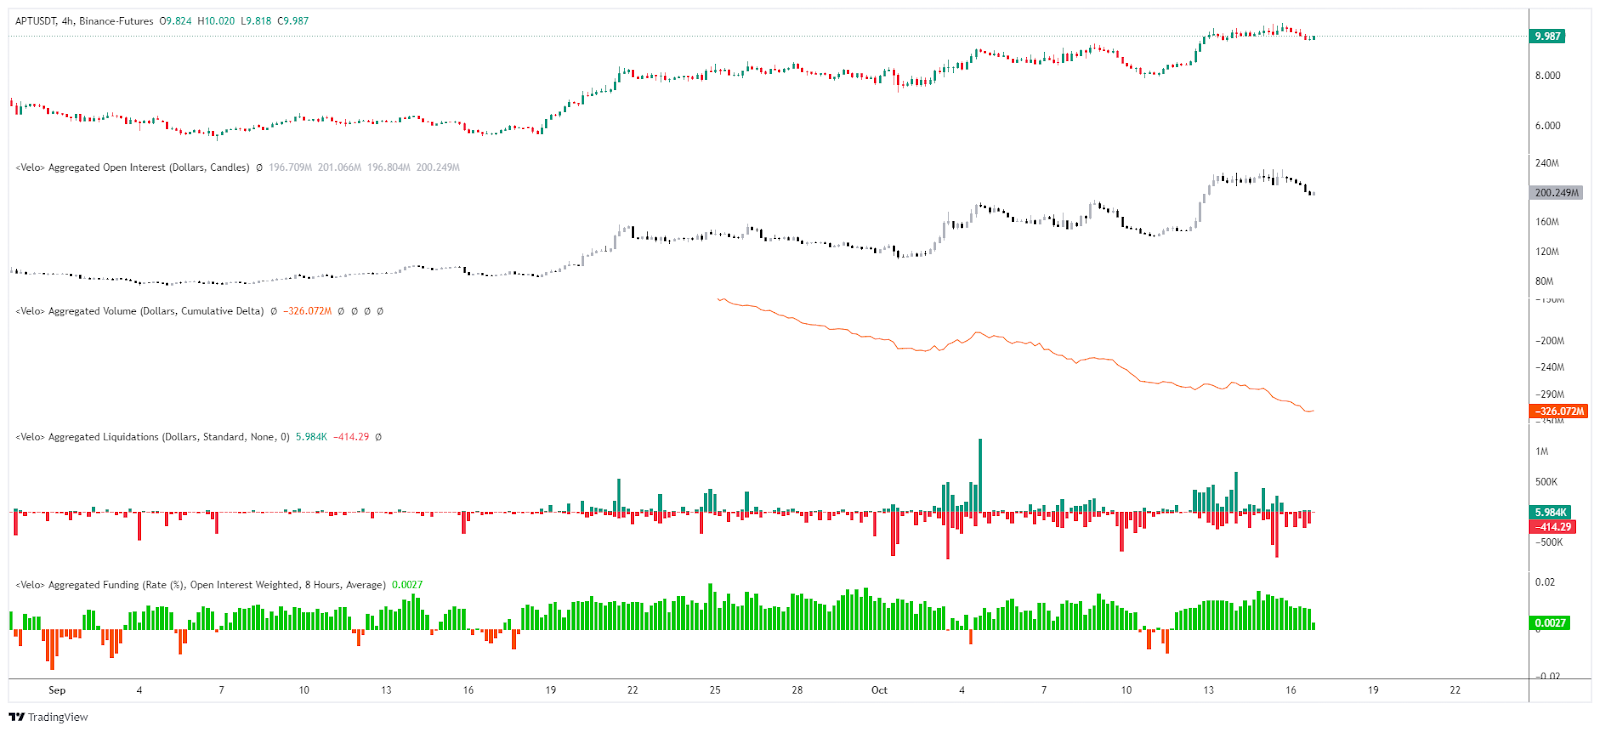
The APT/USDT perpetual contract open interest has moved in lockstep with its underlying, demonstrating growing speculator interest, primarily in buying. However, the CVD diverges completely, being revised downwards. This indicates that there is currently significant selling pressure on Aptos derivatives. This can be explained as much by profit taking as by the accumulation of current short positions.
As for funding rates, these appear slightly positive, illustrating a balance between buyers and sellers on crypto perpetual contracts. As for liquidations, it appears that the latest APT decline has prompted liquidations of long positions. This suggests a possible ongoing capitulation of buyers.
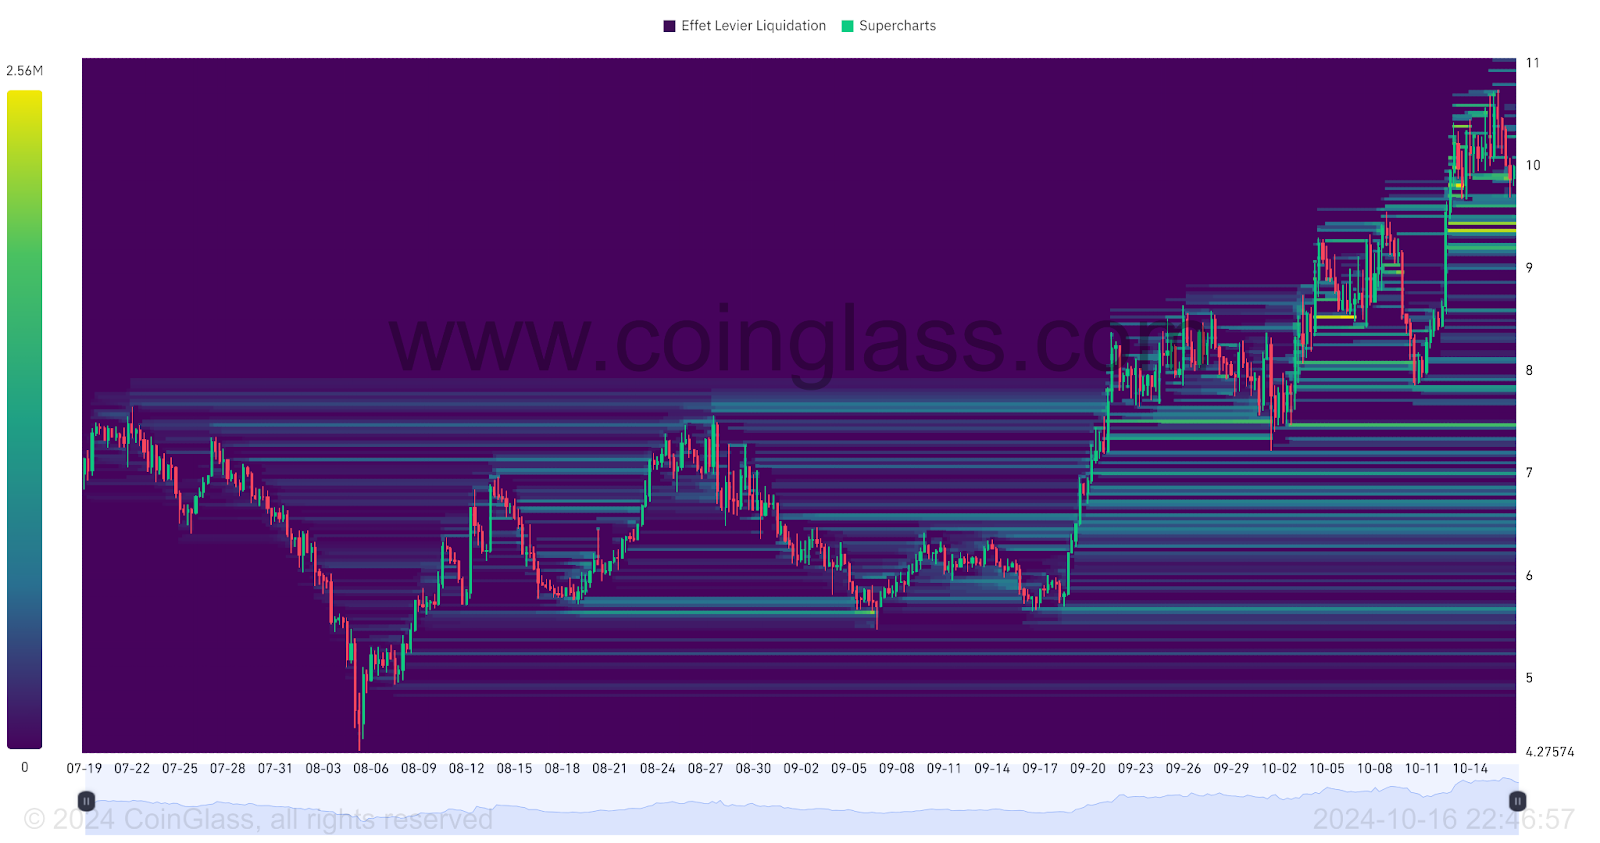
The APT/USDT contract liquidation heatmap indicates that Aptos price is currently in a liquidation zone. This sparked buying interest, causing the price to rise slightly. While this seems encouraging, it is important to note that an even more significant liquidation zone lies just below, between $9.5 and $9. Further down, we also observe the $7.8 and $7.5 zones. If the price approaches these levels, it could trigger a large number of orders, increasing the risk of high volatility for the crypto. These areas therefore represent key points to watch for investors.
Aptos (APT) Price Forecast
- If the price of Aptos remains above $8, or even $7, we could anticipate a bullish continuation up to the $12 level. The next resistance to watch, if the upward movement continues, would be around $14. Beyond that, we can note the level of $18, which would represent an increase of more than 82%.
- If the Aptos price fails to stay above $8, or even $7, we could envisage a return to around $6. The next support to watch, if the bearish movement continues, would be $6. Lower still, we can note support at $5.5, which would represent a drop of around 44%.
Conclusion
Aptos has seen a significant rebound, reaching new highs. Now the trend appears to be bullish, with positive signs for the future. However, resistance slowed its momentum, causing a slight correction in its price. Thus, it will be essential to carefully monitor the price reaction at key levels to validate or revise current forecasts. Finally, remember that this analysis is based solely on technical criteria, and that the price of cryptocurrencies can evolve quickly depending on other more fundamental factors.
Maximize your Tremplin.io experience with our 'Read to Earn' program! For every article you read, earn points and access exclusive rewards. Sign up now and start earning benefits.