

Cosmos has seen an increase of more than 29% in 10 days. Let’s see the future prospects for the ATOM price.
Situation of the Cosmos (ATOM)
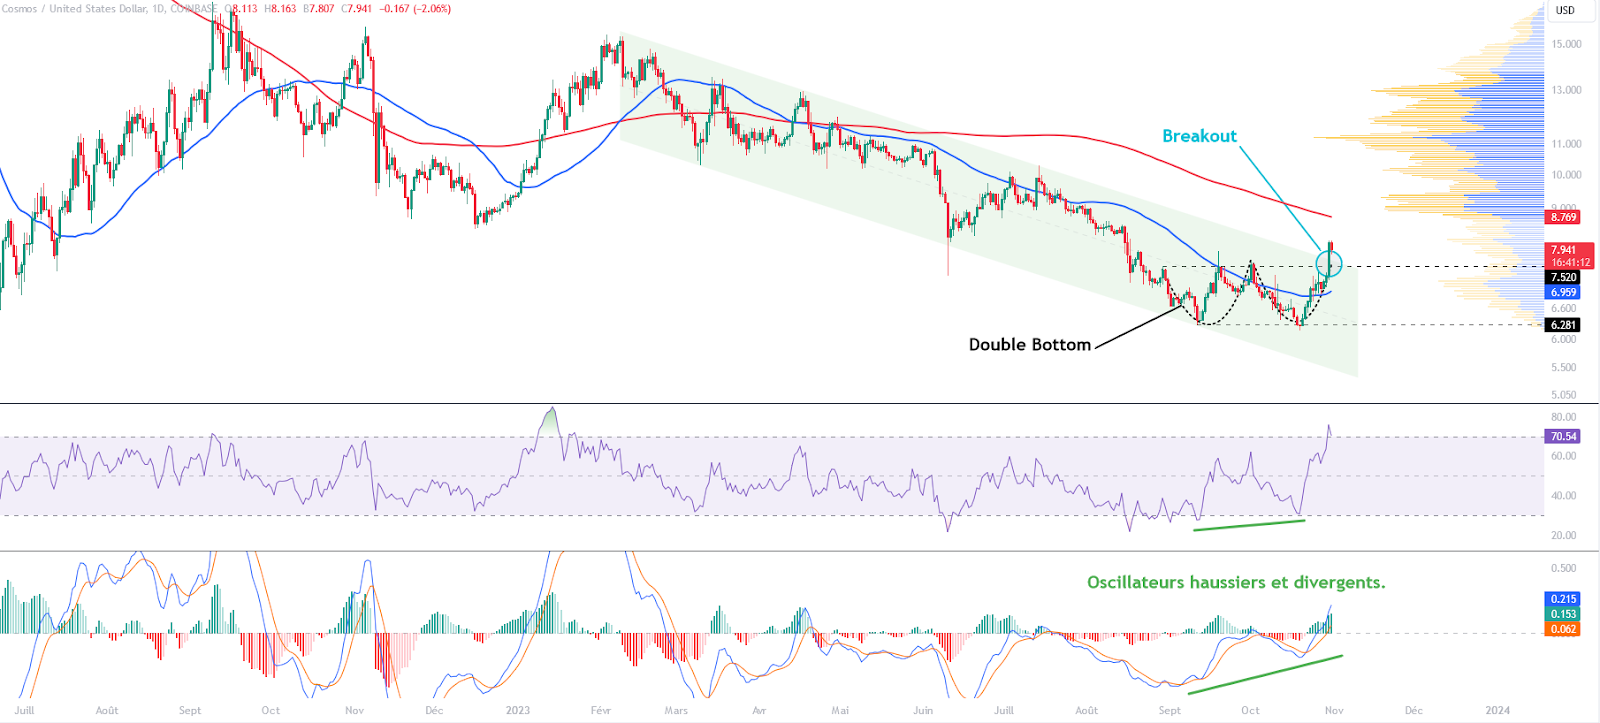
For about two weeks, the price of Cosmos has countered its downward trend. After testing a second time the $6.28, ATOM came to start an upward movement leading Cosmos to overcome its resistance located around the $7.50. Today it is trading just below $8 and is above its 50-day moving average which is now pointing slightly upwards. This is intended to encourage this movement, at least in the short term. However, the Cosmos price is still below its 200-day moving average which is still trending downward, which does not yet support the idea of a change in medium-long term trend. From a chartist perspective, ATOM appears to form a double bottom. This figure is intended to be encouraging for an upward movement. Even more so when coupled with a bullish divergence from the oscillators. Be careful though, the daily RSI being in the overbought zone, this suggests that ATOM is subject to a downward correction or consolidation in the short term.
The current technical analysis was carried out in collaboration with Elie FT, a passionate investor and trader in the cryptocurrency market. Today trainer at Family Tradinga community of thousands of own-account traders active since 2017. You will find Lives, educational content and mutual assistance around the financial markets in a professional and warm atmosphere.
Focus on Cosmos derivatives (ATOMUSDT)
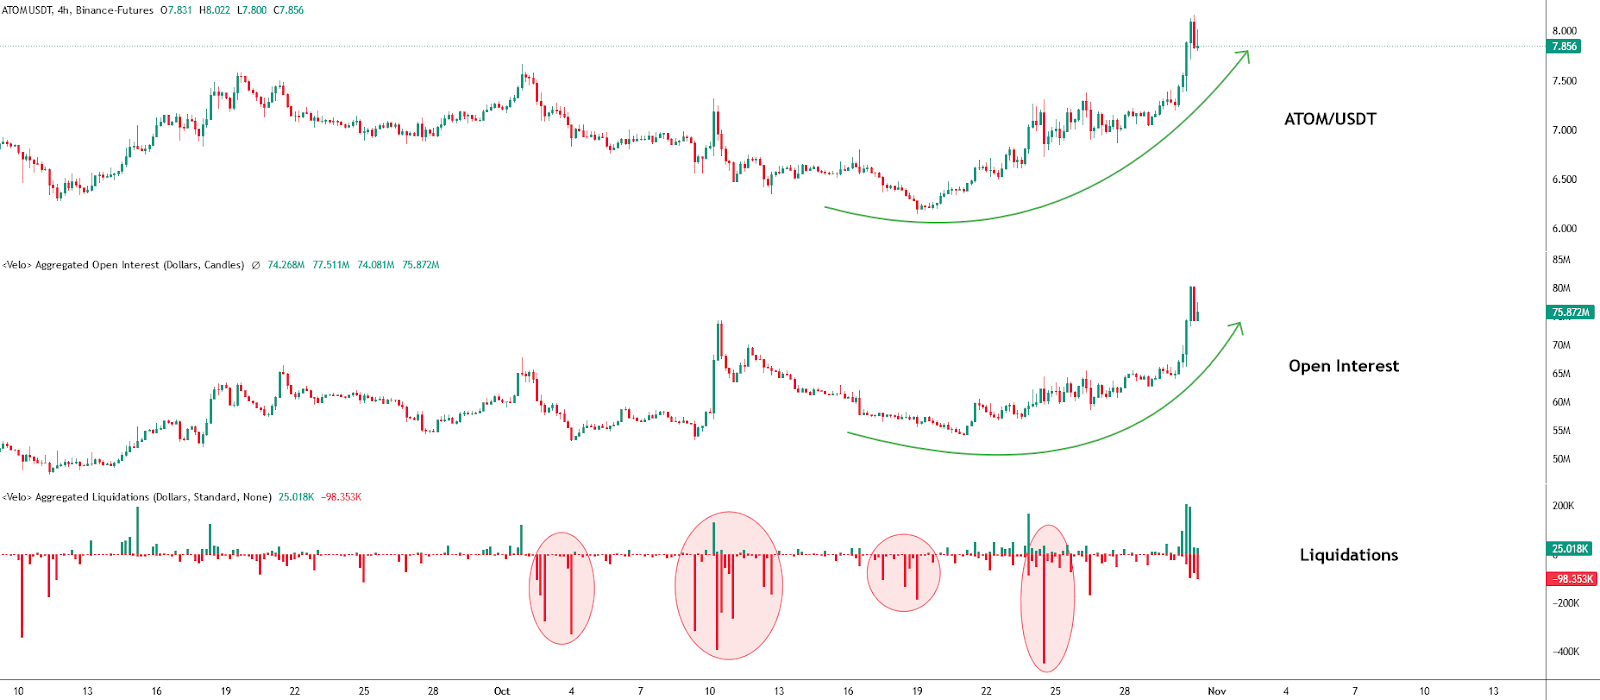
The latest movements of the Cosmos have been accompanied by an increase in open interest. The latter increased to more than +50% with an addition of positions (Long and short) around the +$26.5 million (Binance). This suggests that there is real buying interest in cryptocurrency. On the liquidation side, we mainly observed liquidations on the buyers’ side, which did not negatively impact the ATOM price.
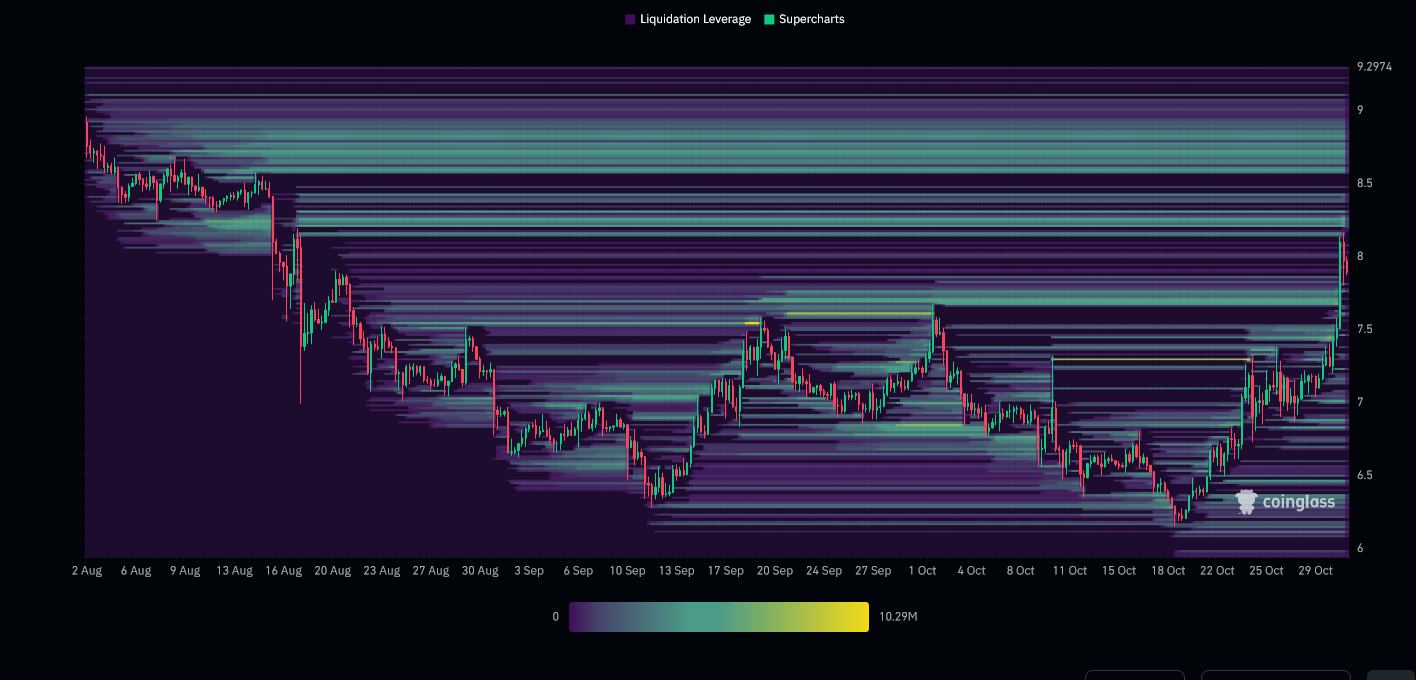
The Liquidation Heat Map of the Cosmos indicates a high liquidity zone around 8.5 And $9. As the market approaches this level, it could trigger a large number of orders, which, naturally, can increase ATOM’s volatility. This therefore makes them attractive areas for investors.
Hypotheses for the course of the Cosmos (ATOM)
If the course of the Cosmos remains above the $7.5we could anticipate a bullish continuation until the $8.5. The next resistance to take into account, if the upward movement continues, would be the threshold of $10. At this stage, this would represent an increase close to +25%.
If the price of the Cosmos does not manage to hold above the $7.5we could consider a return to $7. The next support to take into account, if the bearish movement continues, would be around the $6.28. At this stage, this would represent a drop close to -21%.
Conclusion
The recent bullish impulses of the Cosmos are encouraging. They demonstrate an interest of buyers that should not be neglected. That being said, it is still too early to say that ATOM has changed its medium/long term trend. Thus, this is why it will be important to carefully observe the price reaction on the different identifiable levels to confirm or not the different hypotheses made. Beware of potential “fake out” and “market squeeze” in each situation. Additionally, it should be remembered that these scenarios are based solely on technical analysis. The price of cryptocurrencies may change more or less quickly, depending on other more fundamental factors.
Receive a summary of the news in the world of cryptocurrencies by subscribing to our new service daily and weekly so you don’t miss anything of the Tremplin.io essentials!


