

Bitcoin closed the previous week positive, but still shows signs of weakness. Let’s take a look at the future outlook for the BTC price together.
Status of Bitcoin (BTC)
Bitcoin continued the rise it started from the $40,000 level to reach the $43,000 resistance. This last price level was highlighted in the January 30 analysis. Bitcoin is now showing consolidation in the form of a range around this area. Interestingly, this level coincides with the 50-day moving average. Furthermore, the $42,000 to $44,000 range constitutes a significant value zone for Bitcoin.
A value zone is defined as the price range where an asset has most frequently traded over a given period, highlighting the levels at which trading volume has been the highest.
On the oscillator side, they are stabilizing around the median threshold, which clearly illustrates the fact that Bitcoin’s bullish momentum has faded. Additionally, the bearish divergence between these oscillators and the Bitcoin price still exists. This suggests a potential risk of a fall in the market in the future.
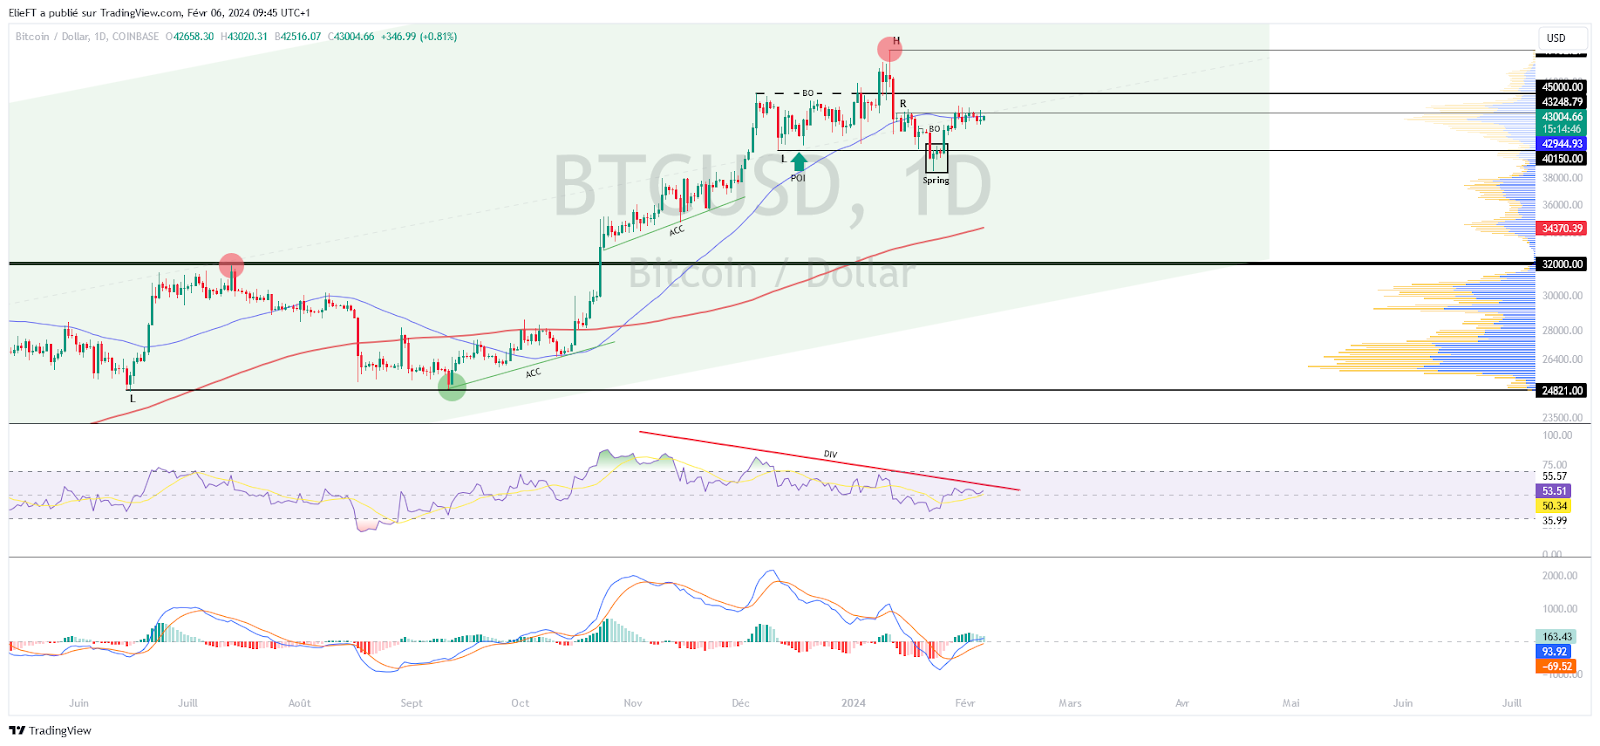
The current technical analysis was carried out in collaboration with Elie FT, a passionate investor and trader in the cryptocurrency market. Today trainer at Family Tradinga community of thousands of own-account traders active since 2017. You will find Lives, educational content and mutual assistance around the financial markets in a professional and warm atmosphere.
Focus on derivatives (BTCUSDT)
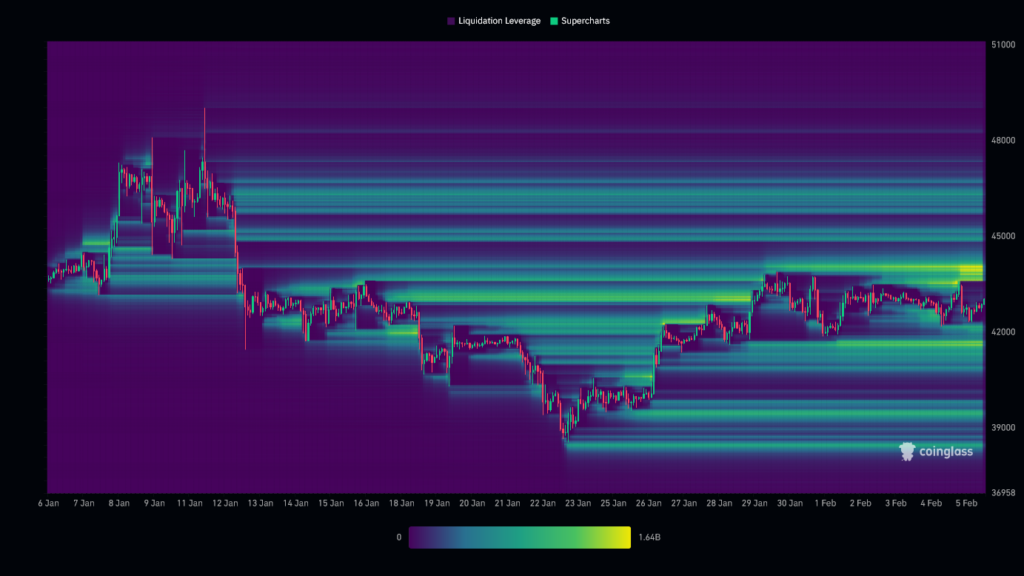
The liquidation heat map for BTC/USD reveals that the liquidation zone around $44,000 has strengthened significantly, making this level particularly significant. Therefore, above the current price, it is important to watch the $45,000 threshold as the next key step. Likewise, below the current price, the level to observe is $41,600. As the market approaches these levels, we could see a massive triggering of orders, potentially increasing the volatility of the cryptocurrency. These areas therefore represent major points of interest for investors.
Hypotheses for the price of Bitcoin (BTC)
If the price of Bitcoin manages to stay above $42,000, we could anticipate a further rise to the $45,000 threshold. The next resistance to take into account, if the bullish movement continues, would be $46,000 or $49,000. At this stage, this would represent an increase close to +14%.
If the price of Bitcoin fails to stay above $42,000, we could envisage a return to $40,000. The next level to take into account, if the bearish movement continues, would be around $38,500 or even $38,000. At this stage, this would represent a drop close to – 12%.
Conclusion
Bitcoin continued its upward trend before entering a consolidation phase. This scenario seems to have created a period of uncertainty for the parent cryptocurrency. Thus, it will be crucial to carefully observe the price reaction at different key levels to confirm or refute the current hypotheses. It is also important to remain vigilant against potential “fake outs” and “market squeezes” in each scenario. Finally, let us remember that these analyzes are based solely on technical criteria and that the price of cryptocurrencies can also evolve quickly depending on other more fundamental factors.
Maximize your Tremplin.io experience with our ‘Read to Earn’ program! For every article you read, earn points and access exclusive rewards. Sign up now and start earning benefits.


