

Bitcoin is trying to catch its breath after a spectacular decline. Having fallen to $59,930, the king of cryptos is today attempting a difficult return to around $70,000. However, is this recovery sustainable or is it just a respite before the next shock?

In brief
- Bitcoin is trading at $70,854 on February 8, 2026, after a staggering 37% fall from its highs.
- Moving averages and MACD display decidedly bearish signals across all time horizons.
- US Bitcoin ETFs are showing signs of stabilization with $330.7M in inflows on Friday, led by BlackRock.
Bitcoin tries to restart after a major correction
Bitcoin price is currently hovering in a tight range between $68,443 and $70,976. This volatility hides a brutal reality: the asset has just suffered a 37% collapse at the start of the year. Liquidations exceeding $1 billion fueled this downward spiral. Institutional investors have massively reduced their positions, creating a gaping void in demand.
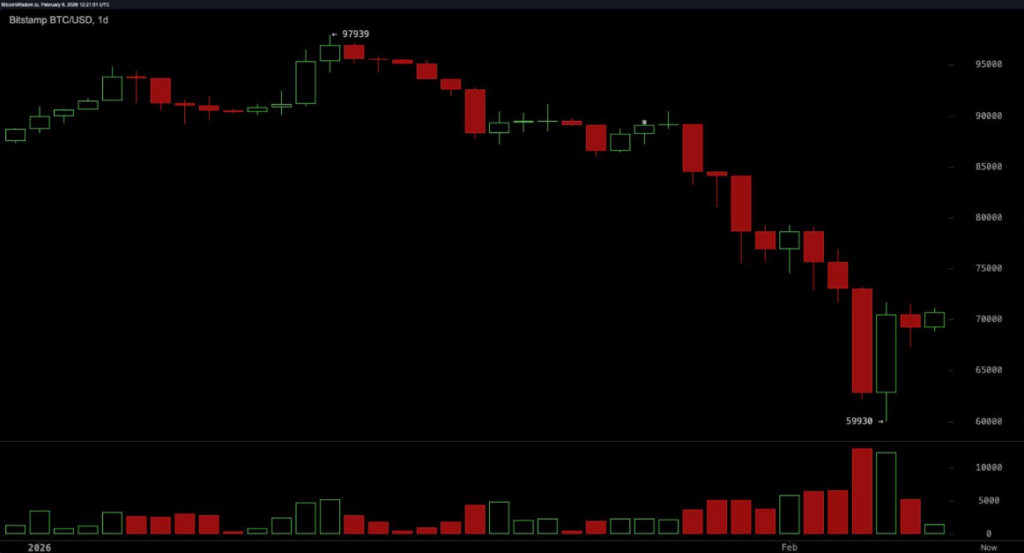
L'technical analysis leaves little room for optimism. All moving averages, whether simple or exponential, point downward. The daily chart draws a succession of decreasing peaks and troughs. The MACD remains firmly anchored in the red.
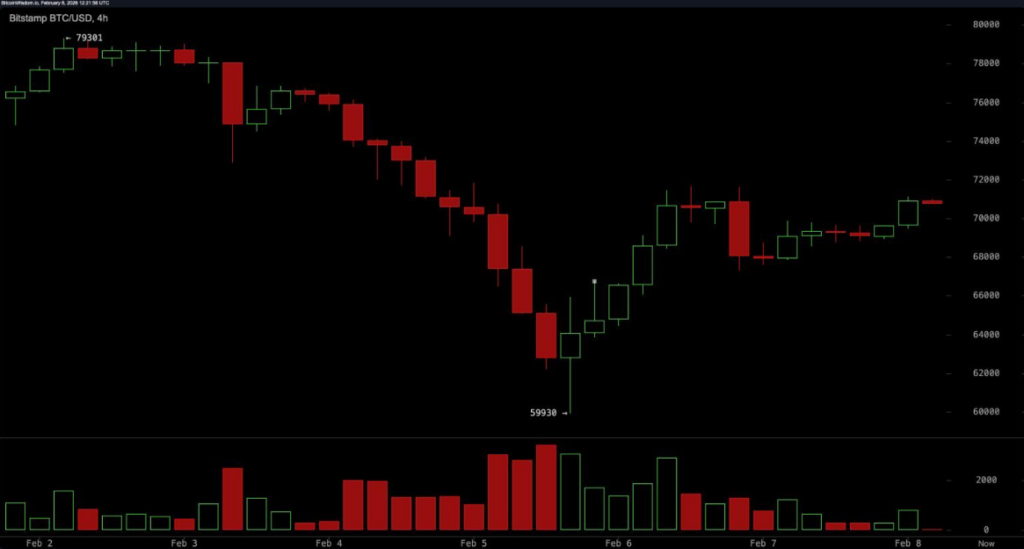
The only positive point: the hourly chart shows ascending lows between $67,313 and $71,673, suggesting that some opportunistic buyers are coming back.
Key resistance lies at $71,673. A clear break above this level could open the way towards $74,000 or even $79,000. However, the opposite is just as likely. Failure to sustain above $68,000 would take the price back towards the $60,000 support. Traders scrutinize every move with the nervousness of those who have already burned their fingers.
Spot Bitcoin ETFs offer a valuable indicator of institutional sentiment. Last Friday, they recorded $330.7 million in inflows after three days of net outflows totaling $1.25 billion.
BlackRock's iShares Bitcoin Trust led the way with $231.6 million. However, this lull does not allay concerns. On Thursday, this same ETF broke a record with $10 billion in trading volume, accompanied by a 13% drop.
The market is falling into a structural bearish phase
CryptoQuant sounded the alarm in early February. The break of the 365-day moving average, recently observed for the first time since March 2022, officially marks the entry into a prolonged bear market.
Since this breakout approximately 83 days ago, bitcoin has fallen 23%. This fall turns out to be faster and more violent than that observed during the bearish phase of 2022.
On-chain indicators confirm this grim diagnosis. CryptoQuant's Bull Market Index shows zero. The growth in stablecoin supply is negative, revealing a contraction in available liquidity.
Coinbase's premium remains in the red, a sign that US investors are no longer actively supporting prices. Trading volumes are collapsing. No signal of reverse capitulation appears on the horizon.
The macroeconomic context doesn't help matters. The high interest rates maintained by the Federal Reserve weigh on all risky assets. Bitcoin no longer enjoys its status as an asset uncorrelated from traditional markets. Institutions that had massively accumulated in 2025 have stopped their purchases. Some even sell. This institutional disaffection amplifies the downward pressure.
Bitcoin is at a critical turning point. The bulls are betting on a decisive crossing of $75,000 to reverse the trend. The bears consider this rebound as a mere flash in the pan before a return to $60,000. Are we witnessing the beginnings of a prolonged bear market?
Maximize your Tremplin.io experience with our 'Read to Earn' program! For every article you read, earn points and access exclusive rewards. Sign up now and start earning benefits.


