BNB suffered a decline of around -20% this summer 2023. Let’s see the future prospects for Binance’s cryptocurrency.
Binance BNB Status
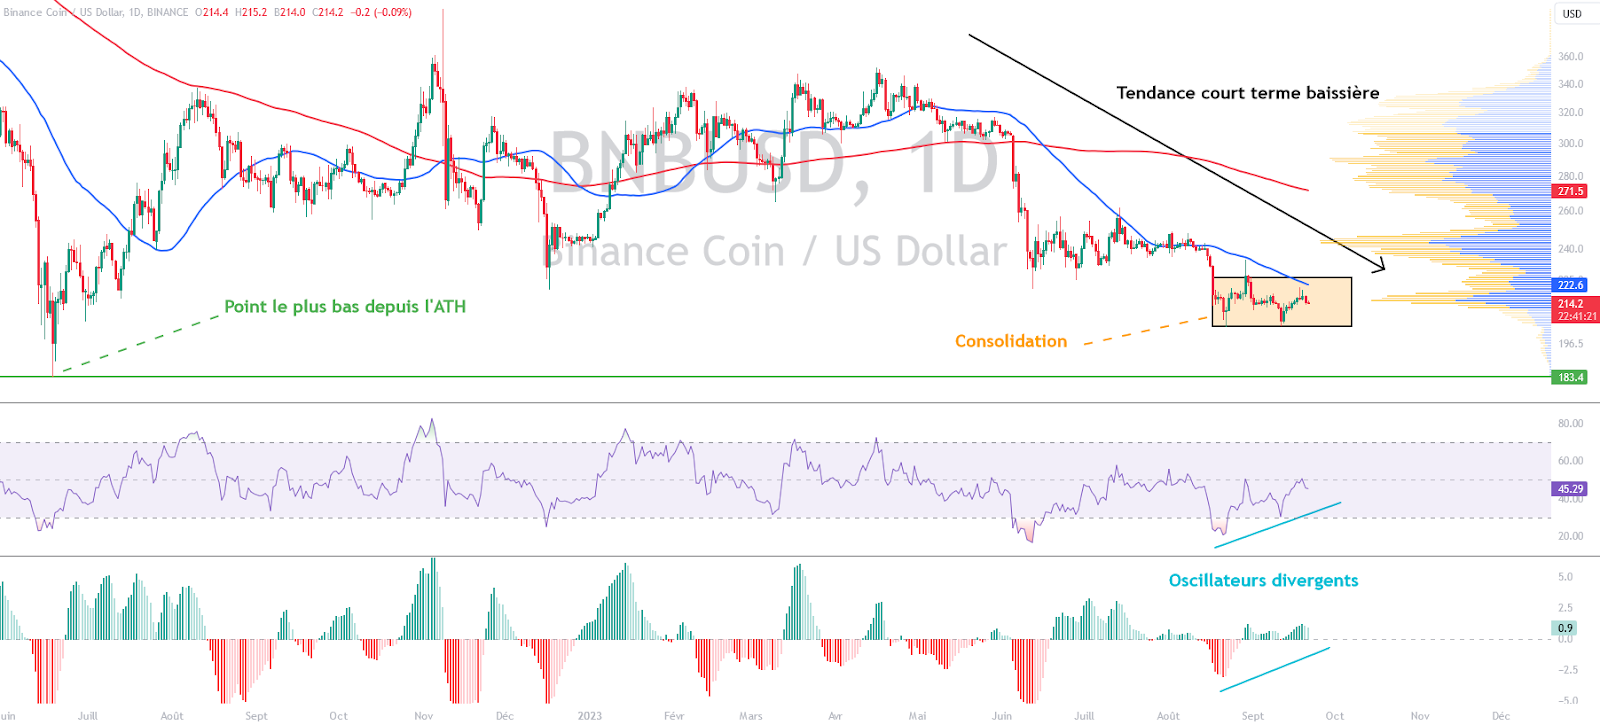
After rejecting $250 in mid-July 2023, the BNB price came continue its decline, getting dangerously close to its low pointcompared to its all-time high.
Now, the famous Binance crypto is trading around $215, the price level where the asset appears to be consolidating. It is below the 50 and 200 day moving average, both of which are trending downward. This highlights the bearish trend that BNB has taken.
Although they have been revised upwards, oscillators still demonstrate bearish momentum. However, it is interesting to highlight a divergence on the latter. Once confirmed, this suggests the arrival of a trend reversal.
The current technical analysis was carried out in collaboration with Elie FT, a passionate investor and trader in the cryptocurrency market. Currently a trainer at Family Trading, a community of thousands of own-account traders active since 2017. You will find Lives, educational content and mutual assistance around financial markets in a professional and warm atmosphere.
Focus on BNB/USDT derivatives
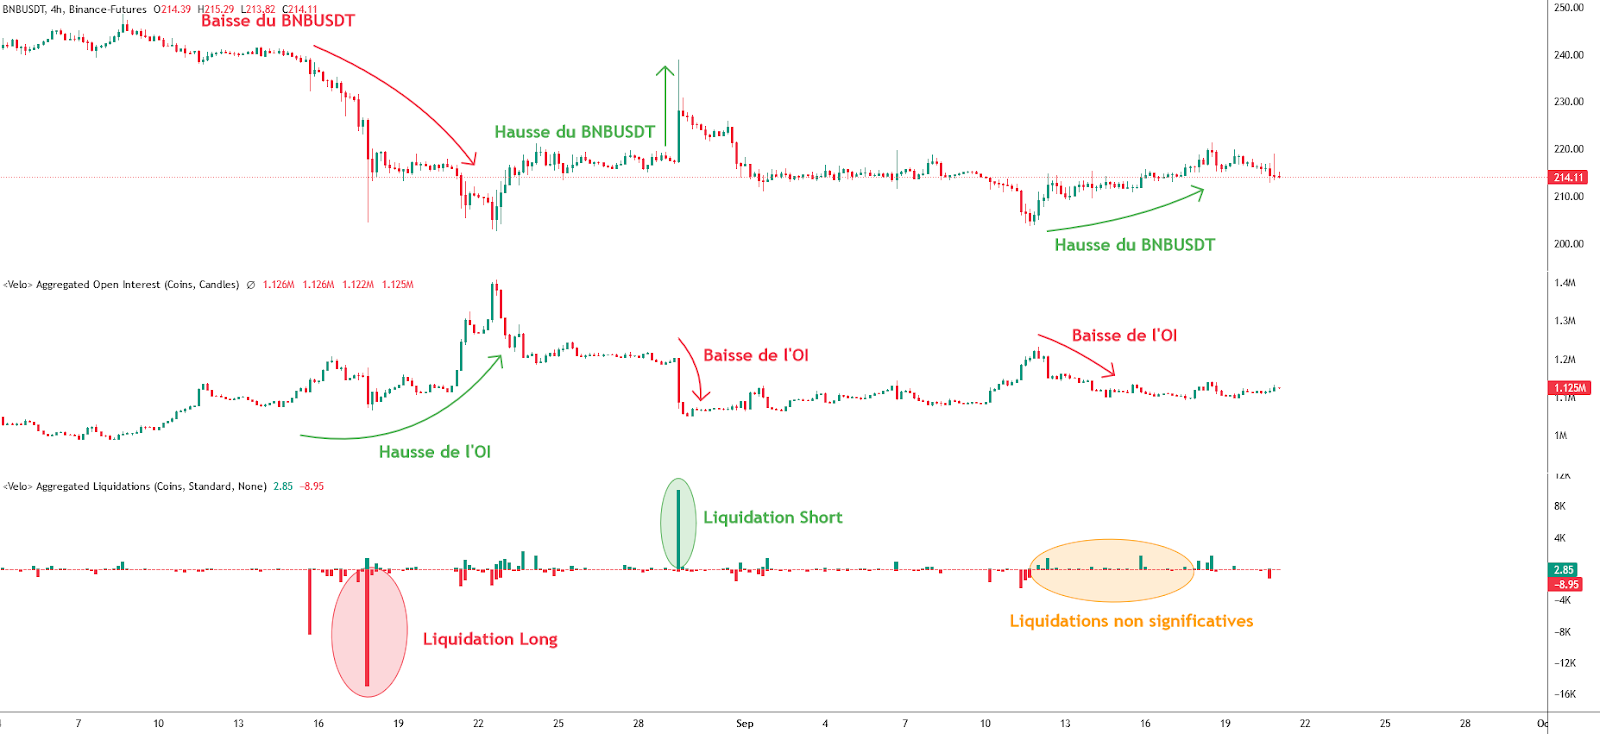
In our analysis of August 23, 2023, we reported that the recent decline in BNB had led to significant selling pressure on the cryptocurrency on the Binance exchange.
As a result of this, a reverse scenario occurred. Indeed, BNB posted an upward recovery which caused liquidations of short positions, which triggered the decline in its open interest. This suggests an exit “forced” short sale positions on BNB.
Recently, a similar scenario can be observed. However, the liquidations have not been as significant. Thus, this suggests that BNB contract sellers are capitulating.
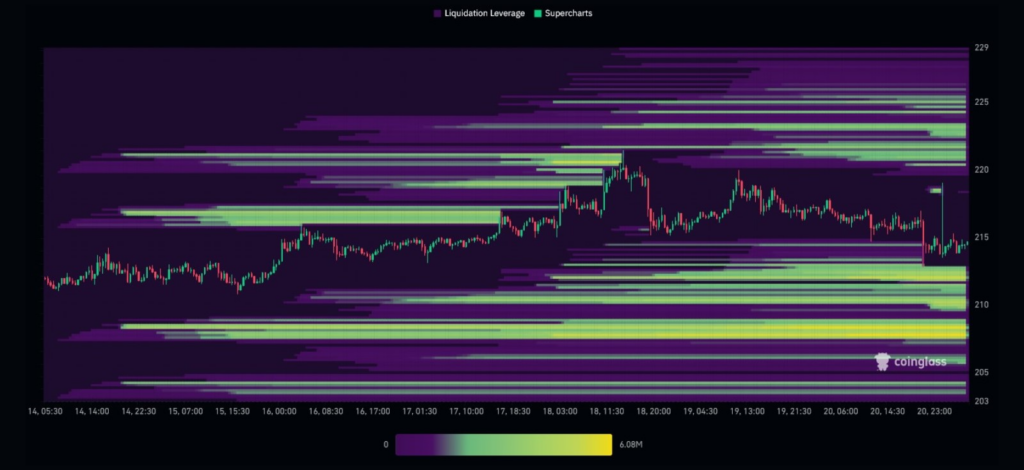
It is interesting to visualize the heat map of liquidations on BNB. We can see that the price of the cryptocurrency comes into contact with a zone of high liquidity, commonly between $212 and $207. If Binance BNB tends towards this price, it could trigger a large number of orders which can naturally increase the volatility of the latter.
Assumptions for the BNB price
- If the price of Binance crypto (BNB) returns above the $230we could anticipate a bullish continuation up to the level of $250. The next resistance to take into account, if the upward movement continues, would be the threshold of $270. At this stage, this would represent an increase close to +25%.
- If the price of BNB fails to return above the $230we could consider a return to $200. The next support to take into account, if the bearish movement continues, would be around the $180. At this stage, this would represent a drop close to -15%.
BNB is currently forming a short-term bearish structure, driving its price towards its lowest point relative to its ATH. We can observe a lack of participation in BNB derivative products. This can be explained in particular by the resurgence of legal context between Binance and the SEC. It is essential to hope for a revival of confidence and a real return of buyers to avoid a continuation of the downward trend. To confirm or not the different hypotheses made, it will be essential to carefully observe the price reaction on the different identifiable levels. Beware of potential “fake out” and “market squeeze” in each situation. Additionally, it should be remembered that these scenarios are based solely on technical analysis. The price of cryptocurrencies may change more or less quickly, depending on other more fundamental factors.
Receive a summary of the news in the world of cryptocurrencies by subscribing to our new service daily and weekly so you don’t miss anything of the Tremplin.io essentials!