
The cryptocurrency market remembers the sudden fall of bitcoin below $58,000 in July. However, on-chain data shows a much weaker reaction than expected after this low. This discretion of buyers now raises a central question: did this level really represent a sustainable floor? The HODL Waves indicator sheds precise light on recent supply movements. Its evolution suggests above all a slow accumulation, very different from the reactions observed during previous low points of the cycle.

In brief
- Bitcoin briefly fell below $58,000 on July 1, reaching its lowest level since September 2024.
- The supply held for one to seven days only increased from 1.97% to 2.35% after this low.
- Willy Woo calls this weak onchain reaction an “anomaly” and refers to an accumulation led by few buyers.
- Analysts continue to debate the status of the July low and the risk of a further decline.
- In August, US spot bitcoin ETFs saw $3.8 billion in net inflows in three weeks.
A limited reaction after Bitcoin fell below $58,000
The on-chain HODL Waves indicator ranks bitcoin according to how long it has been inactive in wallets. It allows you to track several offer groups. The slice inactive for one to seven days gives an indication of activity after a significant movement. This measurement forms the wavy pattern of the chart and helps observe changes around key prices.
On July 1, the price of bitcoin/USD briefly fell below $58,000. It reached its lowest level since September 2024, according to indicator data. However, the supply that has been inactive for one to seven days has not moved significantly. It represented 1.97% of the supply that day, before reaching only 2.35% on July 5.
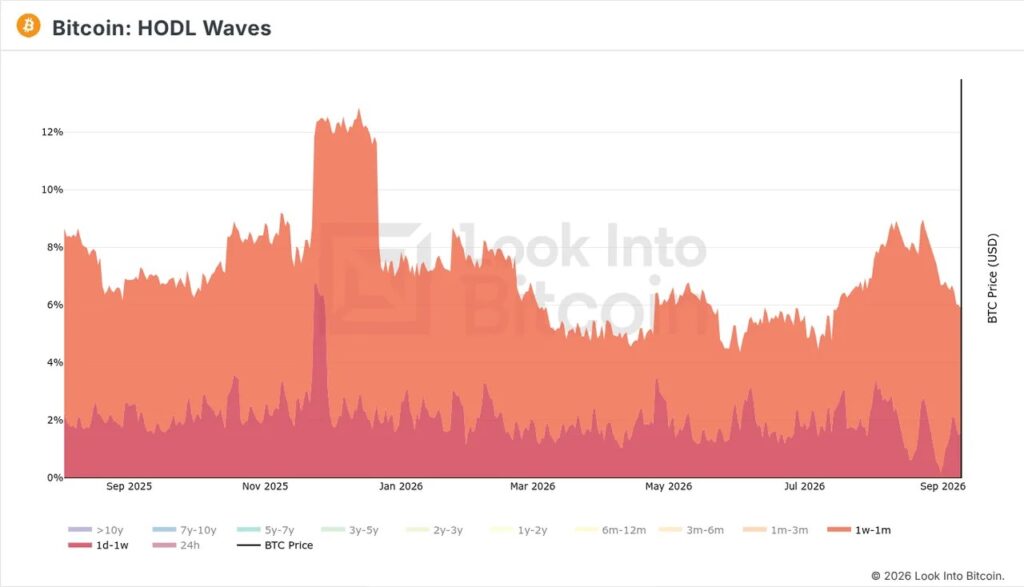
This limited progression contrasts with the reactions associated with major price floors. During previous declines, buyers took advantage of new levels to enter the bitcoin market. In July, this rapid reaction does not appear in the available data. The movement remains weak enough to fuel questions about the strength of the trough.
Willy Woo notices an anomaly in on-chain data.
For on-chain analyst Willy Woo, this low variation contrasts with the behavior observed during long bitcoin lows. In his post on X, he believes that buyers previously mobilized quickly when prices reached new lows. This time, the blockchain does not show the same collective movement. Woo therefore considers this lack of peak to be an anomaly in the HODL Waves model.
The analyst also believes that the bottom buying may have taken place gradually, with possibly a single whale causing part of the movement. He emphasizes that this reading remains uncertain. Institutional investment vehicles may change the interpretation of HODL Waves data. This reservation prevents us from drawing a definitive conclusion on the behavior of investors.
Woo also puts forward another possibility: several buyers could have accumulated regularly, without causing a net increase. According to him, a large group would be more likely to react together to price fluctuations. Such coordination would have created visible spikes in the data. The absence of these peaks reinforces the hypothesis of a limited number of buyers or a gradual accumulation.
The July low remains debated despite the rebound
These observations fuel doubts about the status of the low recorded in July. The question remains whether the move below $58,000 was the latest low point in the bitcoin bear market. Bitcoin’s subsequent rebound above $80,000 reignited the debate. Some observers rely on previous price movements to predict a new macroeconomic low.
For its part, Rekt Capital believes that the bearish structure remains visible through a series of lower and lower highs. According to this analysisthe trend has therefore not yet invalidated the scenario of a further decline. He cited increased risk in the event of a weekly close below $78,300. This configuration could cause a marked fall, like last May.
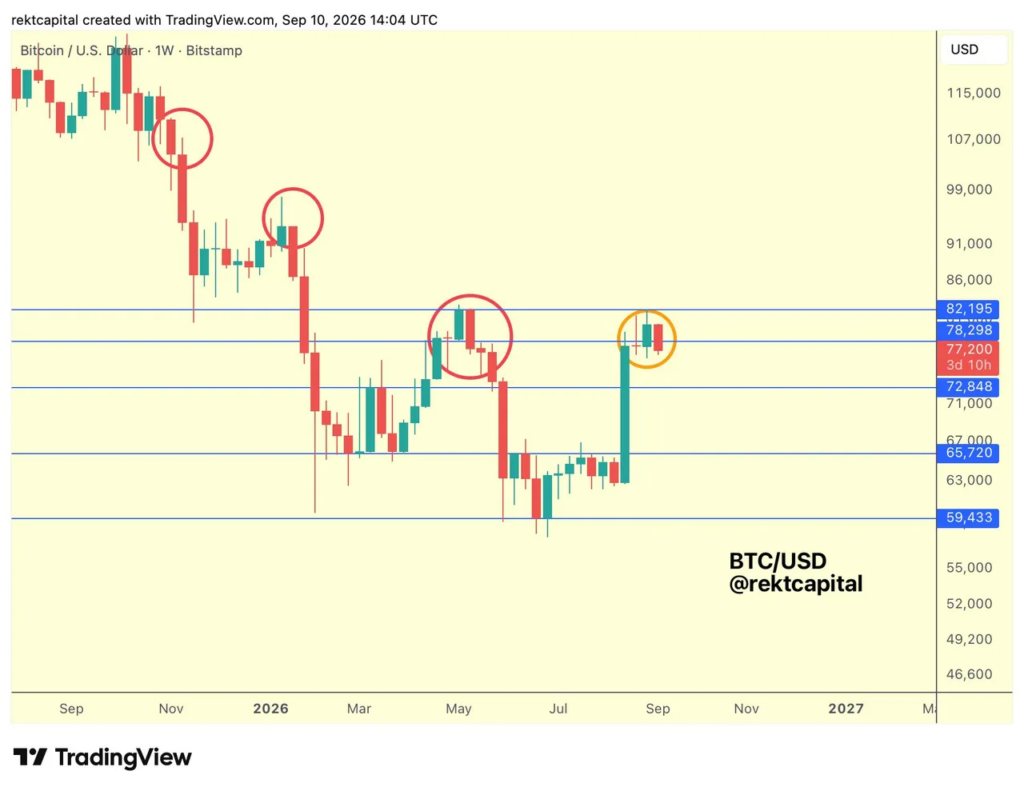
However, buyer appetite changed in August. US spot bitcoin ETFs saw $3.8 billion in net inflows over three weeks. This recovery brings a new element to the analysis. It shows that demand can return after a period of wait-and-see, without resolving the question of the July floor.
The bottom below $58,000 therefore does not yet provide a definitive answer on the end of the bear market. The weakness of on-chain movements contrasts with the rebound in flows observed in August. If the accumulation remains gradual, the market could test previous levels. For Bitcoin, the upcoming HODL data will help determine whether July actually marked the bottom.
Maximize your Tremplin.io experience with our ‘Read to Earn’ program! For every article you read, earn points and access exclusive rewards. Sign up now and start earning benefits.