

Ethereum is attempting to stabilize after a strong sell-off this weekend, but confirmation of a lasting bottom remains elusive. Although price action has calmed down after Sunday's drop, the broader market structure still reflects a corrective phase rather than the start of a sustained uptrend. Meanwhile, momentum remains weak, and derivatives positioning suggests that the recent rebound was largely due to short-term reactions rather than further accumulation.

In brief
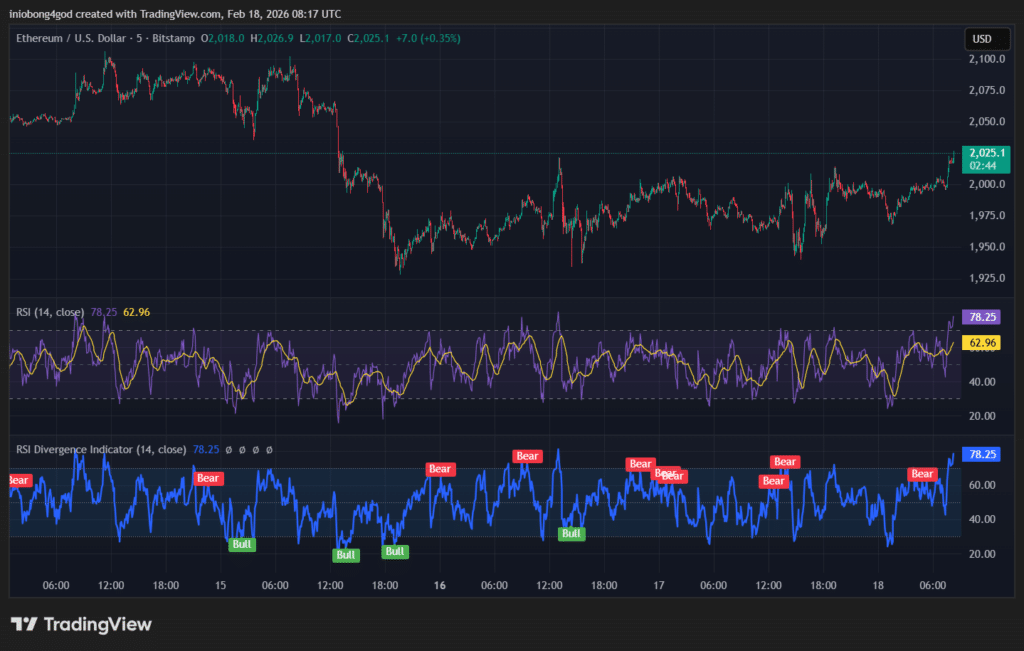
- Ethereum is rejected near $2,025 as momentum remains weak on lower timeframes.
- $44.5M in liquidations show that long positions triggered the initial sell-off.
- The recent rise is mainly fueled by short covering, not fresh long exposure.
- Key liquidity levels at $1,929 and $2,107 influence ETH’s next move.
ETH rejected near $2,025 as long liquidations dominate selling
Recent technical updates indicate that bearish scenarios remain in play unless Ethereum produces a sharp five-wave impulsive advance or reclaims the weekend high near $2,107. So far, the rebound from last week's low lacks the expansion typical of sustained reversals. Price action appears chaotic and compressed, especially on lower time frames.
On the 5-minute chart, Ethereum moved sideways after the sell-off, repeatedly facing rejection around the $2,015 – $2,025 area. Breakout attempts failed to gain momentum. Momentum indicators reflect this hesitation. Relative Strength Index (RSI) readings have fluctuated between 42 and 57, unable to rise above the 60–65 zone often signaling trend strength.
Of the bearish divergences short-term trends appeared near local highs, while bullish divergences near lows did not translate into sustained upward movement. Range behavior continues to dominate.
Derivatives data paints a similar picture of fragility. Over the past 24 hours, total Ethereum liquidations reached $44.5 million. Long positions accounted for $27.77 million, while short liquidations totaled $16.72 million. The 12-hour data shows a similar imbalance, suggesting that the initial move lower was driven by forced exits from long positions.
ETH Liquidation Imbalance Points To Temporary Bullish Pressure
Short-term data, however, shows a change. Over the past hour, approximately 93% of liquidations were short positions, or about $333,000 compared to just $24,000 in long liquidations. The 4-hour window shows $798,000 in short liquidations versus $57,000 in longs. Such activity indicates that the recent rally has been largely fueled by short covering rather than aggressive new long exposure.
The main derivatives signals currently shaping the structure of Ethereum include:
- Long liquidations dominated the broader 24-hour window, confirming strong selling pressure during the initial decline.
- Short liquidations increased sharply on short intervals, indicating a reactive squeeze to the upside.
- Open interest has not increased significantly, suggesting limited fresh capital entering the market.
- Funding rates remain volatile, reinforcing the role of leverage in recent moves.
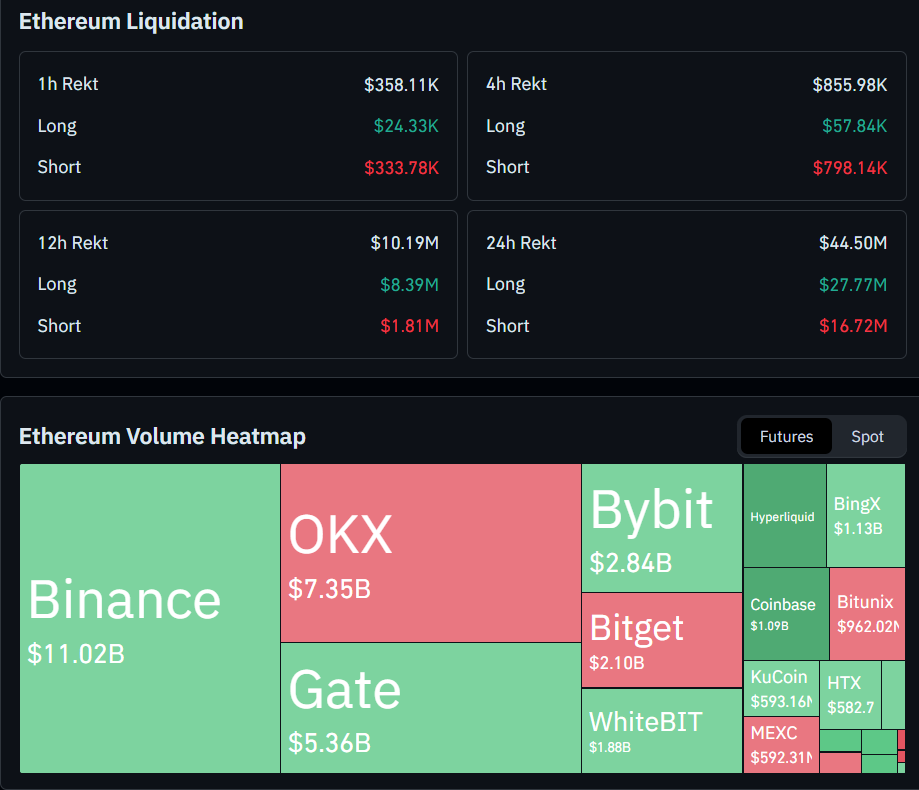
Futures markets remain the main driver of activity. Binance leads futures volume with around $11.02 billion in activity, followed by OKX at $7.35 billion and Gate at $5.36 billion. Such concentration in derivatives trading means that leverage continues to dictate short-term price movements.
When futures dominate flows, markets often react quickly to pockets of liquidity, leading to rapid intraday reversals rather than stable directional trends.
Liquidity magnets at $1,929 and $2,107 define Ethereum's next move
Liquidity benchmarks formed over the weekend now frame the near-term outlook. Ethereum printed relatively low extremes near $1,929 on the downside and $2,107 on the upside. Both levels are likely to attract prices in the coming days. A crossing of the $1,946–$1,929 zone could release resting liquidity and potentially set the stage for a stronger reversal attempt towards the weekend high.
Conversely, continued strength without first revisiting these lower levels could open the way for short setups, particularly if price stalls near $2,107. H1 liquidity around $2,015 also plays a critical role. Sustained acceptance above this zone could allow continued upside, while rejection could renew downward pressure.
For now, Ethereum is operating in a technically sensitive zone following a liquidation flush. Weak hands are out, and shorts have been squeezed, but structural confirmation is still lacking. As long as price action remains reactive and not impulsive, recovery attempts remain vulnerable to further selling pressure.
Maximize your Tremplin.io experience with our 'Read to Earn' program! For every article you read, earn points and access exclusive rewards. Sign up now and start earning benefits.


