Bitcoin recently plunged under $ 113,000, causing a shock wave on the markets. This drop of more than 8 % since its $ 124,000 summit sparked a wave of pessimism among private investors. But behind this apparent panic, some analysts see a contrary signal which could announce a reversal.

In short
- Bitcoin fell to $ 113,000, triggering panic among private investors despite solid fundamentals.
- Institutional people like Strategy are massively buying bitcoin, suggesting a contrary strategy in the face of the ultra bearish feeling of retail.
- The technical indicators and the emotional context evoke a possible bear trap of Bitcoin, announcing a rebound rather than a sustainable lower market.
Brutal bitcoin correction … but not unprecedented
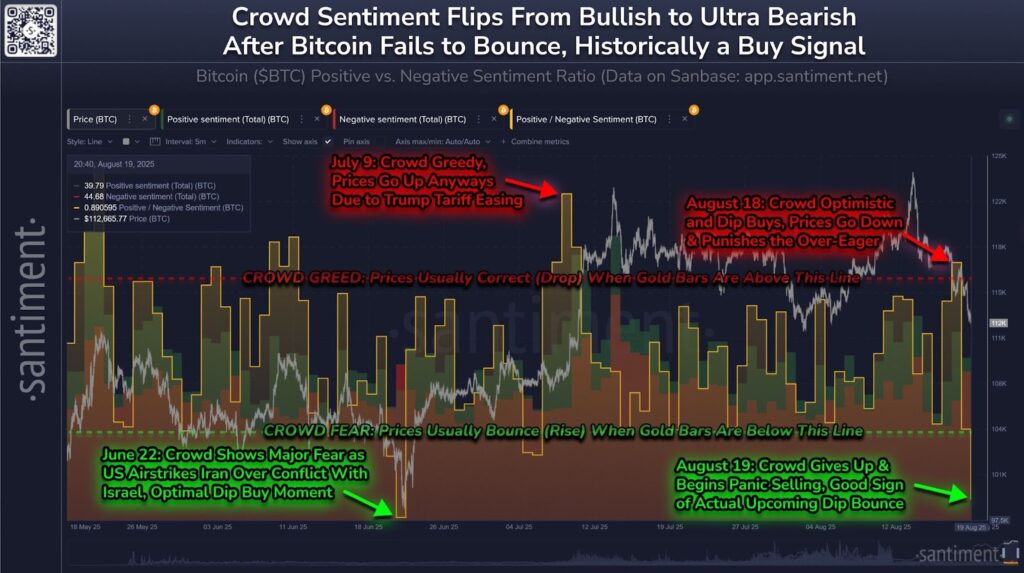
After falling under $ 115,000, Bitcoin dropped $ 112,000 on August 19, 2025, marking one of its strongest corrections for several months. Social networks reacted virulence: the crypto forums filled with alarmist messages, and the small carriers began to liquidate their positions in a climate of generalized fear.
According to health data, The feeling of private investors has become ” Ultra Bearish »»reaching its most negative level since June. This type of extreme pessimism is often interpreted as a potential reversal indicator, especially when the fundamentals remain solid.
Bitcoin: When the institutionalists buy while the panic retail
While particular traders react emotionally, institutionalists adopt a strategic posture. Actors like Strategy took advantage of the decline to strengthen their positions by buying additional 430 BTC at $ 51.4 million. Thus betting on a medium -term recovery.

This contrast illustrates a well -known dynamic: when retail sells in fear, whales buy in silence. Historical precedents reinforce this hypothesis. In 2017, a fall in Bitcoin of 36 % in September preceded a new summit three months later. In 2021, a similar drop had been followed by a Haussier rally.
Technical analysis of the BTC: between tension and hope of rebound
Several technical indicators suggest an unstable situation of Bitcoin, but not desperate. Indeed :
- The RSI at 41 remains in neutral zone, leaving room before an occurrence;
- The negative macD indicates a low -cost momentum, but without brutal collapse;
- The 50 -day mobile average at 115,870 dollars acts as resistance;
- A head-up pattern in training could cause BTC break around $ 108,000, or even $ 105,150 if the support of $ 112,000 gives way.
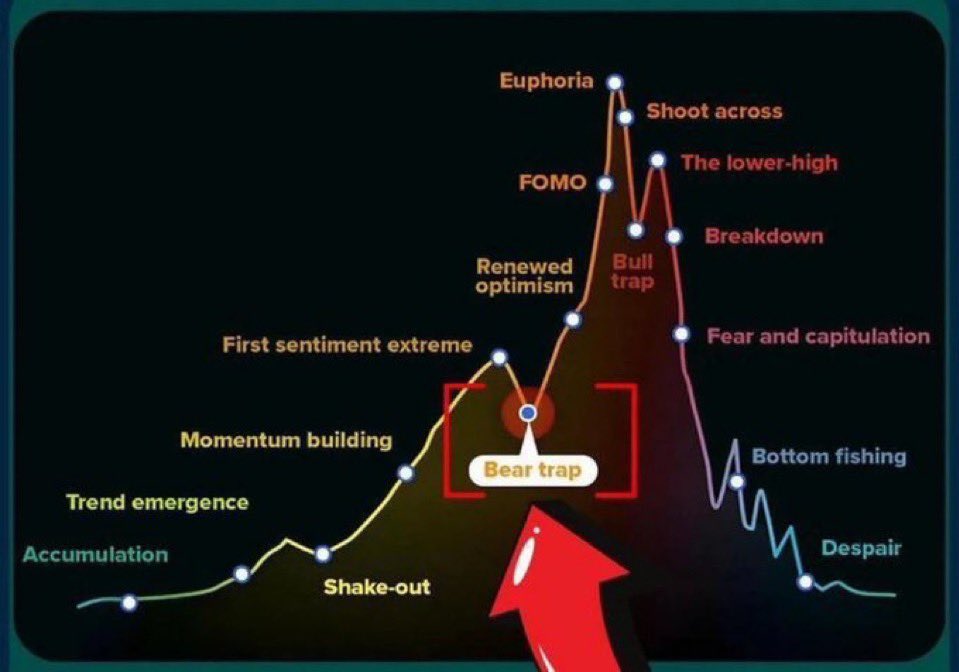
Bear Trap of Bitcoin: What if the fall was a trap?
This configuration could correspond to a ” Bear Trap Bitcoin, a lower trap where the market simulates a negative trend to encourage sale … just before a rebound.
As Ryan Lee, chief analyst at Bitget, said, this fall could be a false lower signal:
If the threshold of $ 112,000 holds as a support, it could well be the starting point for a new upward leg, rather than a reset of the market.
Retail pessimism, institutional accumulation and technical support hold this hypothesis. Therefore, Bitcoin investors should not give in to panic. They must observe weak signals and think in the long term.
The fall of Bitcoin at $ 113,000 is therefore not necessarily the start of a lower market. It may well be a strategic breathing, announcing a new bullish cycle for those who know how to read between the lines. However, the shadow of the Ghost Month Plane and the BTC could sink to $ 100,000.
Maximize your Cointribne experience with our 'Read to Earn' program! For each article you read, earn points and access exclusive rewards. Sign up now and start accumulating advantages.