

Bitcoin has signs of lower pressure after its last historic summit. Discover the technical perspectives for the future evolution of the BTC.

In short
- Bitcoin consolidates around $ 113,800, -1.5 % over the week, increased volumes.
- Handy trend confirmed in the medium/long term, but short -term shortness of breath.
- Open interest in decline, Funding Rate High confirming a bias bias.
- Rebound possible above key supports, risk of correction in case of rupture.
Bitcoin technical analysis (BTC/USD)
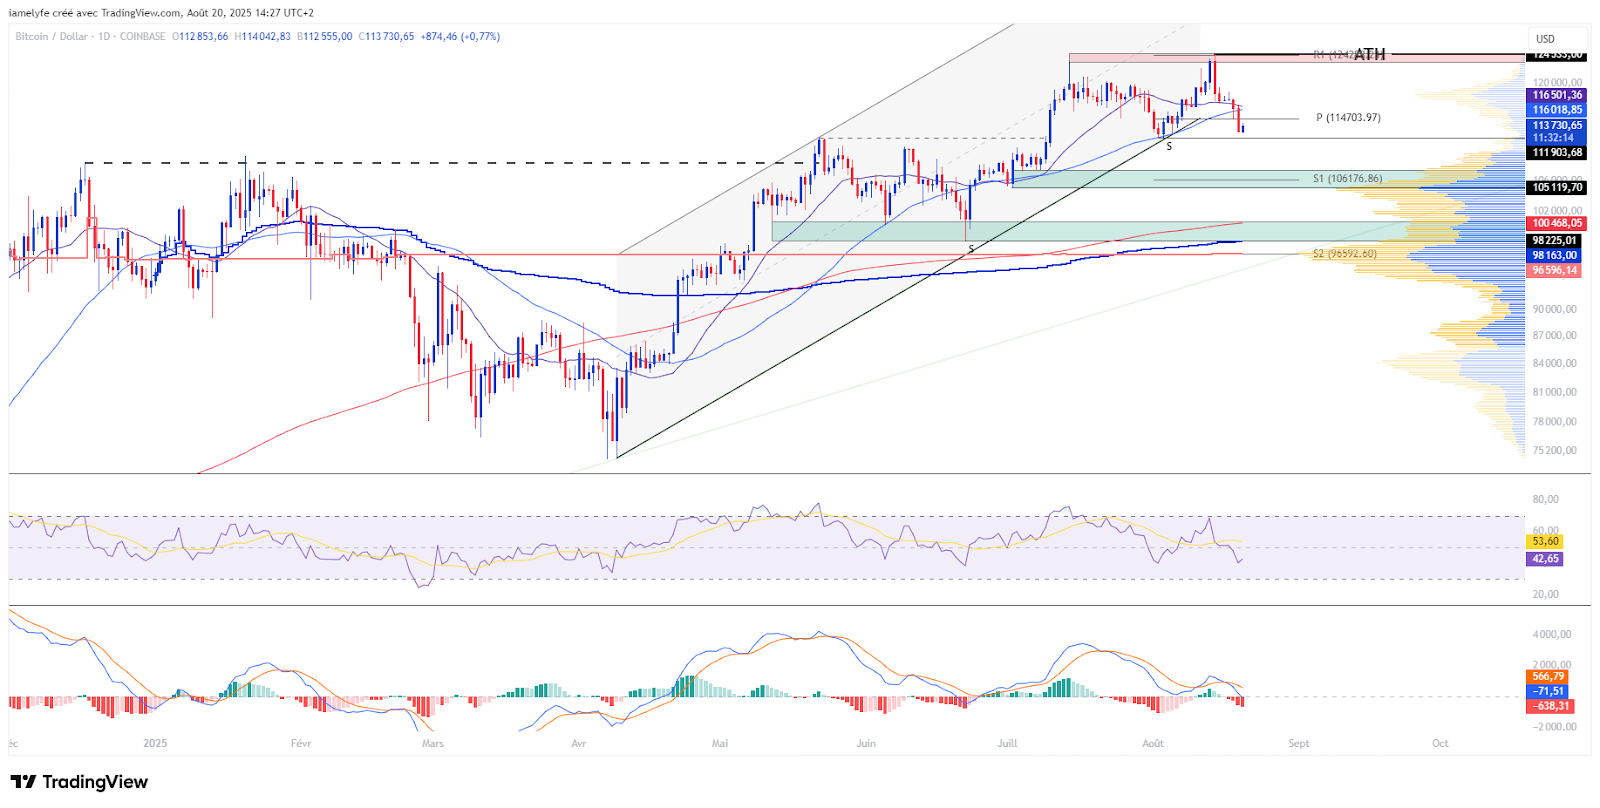
Bitcoin is currently exchanging around $ 113,800, after a correction following the failure to maintain the last ATH. Over the week, the performance has a moderate decrease of approximately 1.5 %, translating a break into the recent upward dynamics. Weekly volumes reach 48 billion, up 34 %, signaling a revival of market engagement despite this technical withdrawal. On the structural level, the trend remains upwards in the long term (SMA 200) and upward up in the medium term (SMA 50), confirming a solid basic dynamic. However, the short -term trend (SMA 20) has neutralized, reflecting a breathlessness and a possible stabilization or withdrawal phase. Finally, the momentum shows a slight decline, without invalidating the bullish backdrop which continues to dominate.
Bitcoin technical levels (BTC)
Bitcoin faces a technical configuration marked by well -defined reference areas. The main resistance remains at the Ath of $ 124,533, considered as a potential distribution threshold where the sales pressure could be strengthened. Key materials are $ 111,900, $ 107,400 and $ 105,200, corresponding to major defense levels and likely accumulation areas. The last daily break at $ 112,000 allowed resistance to crossing, opening onto an expansion phase before a slight correction manifests itself. The monthly pivot point at $ 114,703, located below the current course, serves as a benchmark to assess the trend of the month. Finally, the value areas structure the market balance: the high terminal at $ 118,145 marks a critical area whose crossing could trigger a bullish imbalance, while the low terminal at $ 104,620 would represent a threshold of vigilance in the event of increased sales pressure.
Market feeling
The market feeling, measured by the Fear & Greed IndexCurrently indicates a state of fear, translating a switch from the previous euphoric phase. Regarding institutional flows, Bitcoin ETF record moderate clearances, online with recent market development.
Current technical analysis was carried out in collaboration with ElyfeAnd 0xhugzerinvestors and popularizers on the cryptocurrency market.
Analysis on derivatives (BTC/USDT)
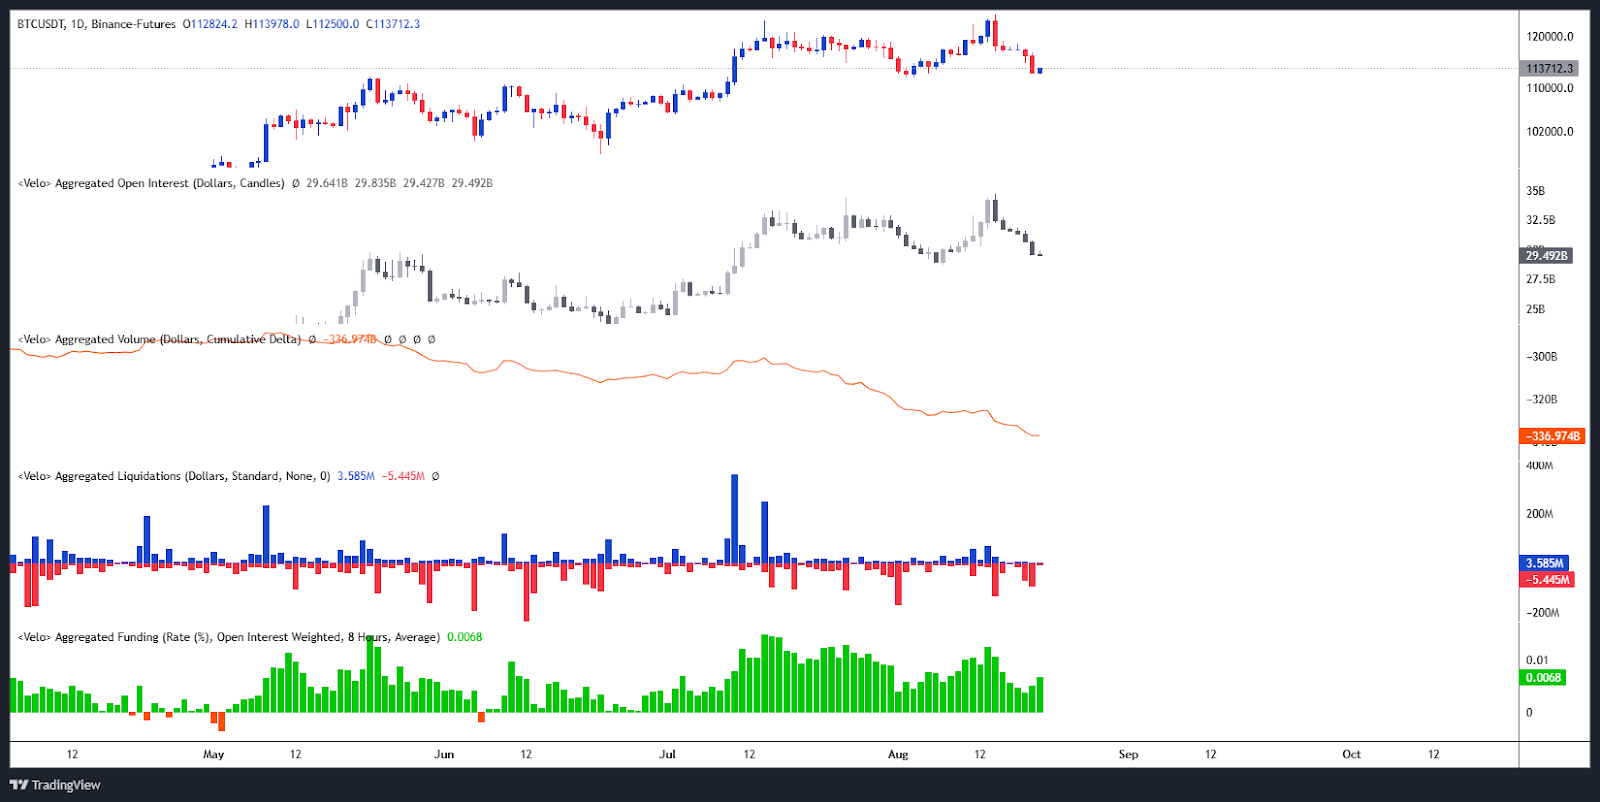
Open Interest is decreasing, indicating a reduction in speculative positioning on derivatives. The CVD highlights a selling dominance, with flows oriented for sale and a marked imbalance. Liquidations, moderate, mainly concern long positions. Finally, the funding rate, still high and positive, confirms a bias bias with a significant bonus in favor of long positions, but likely to slow the demand for new short -term exhibitions.
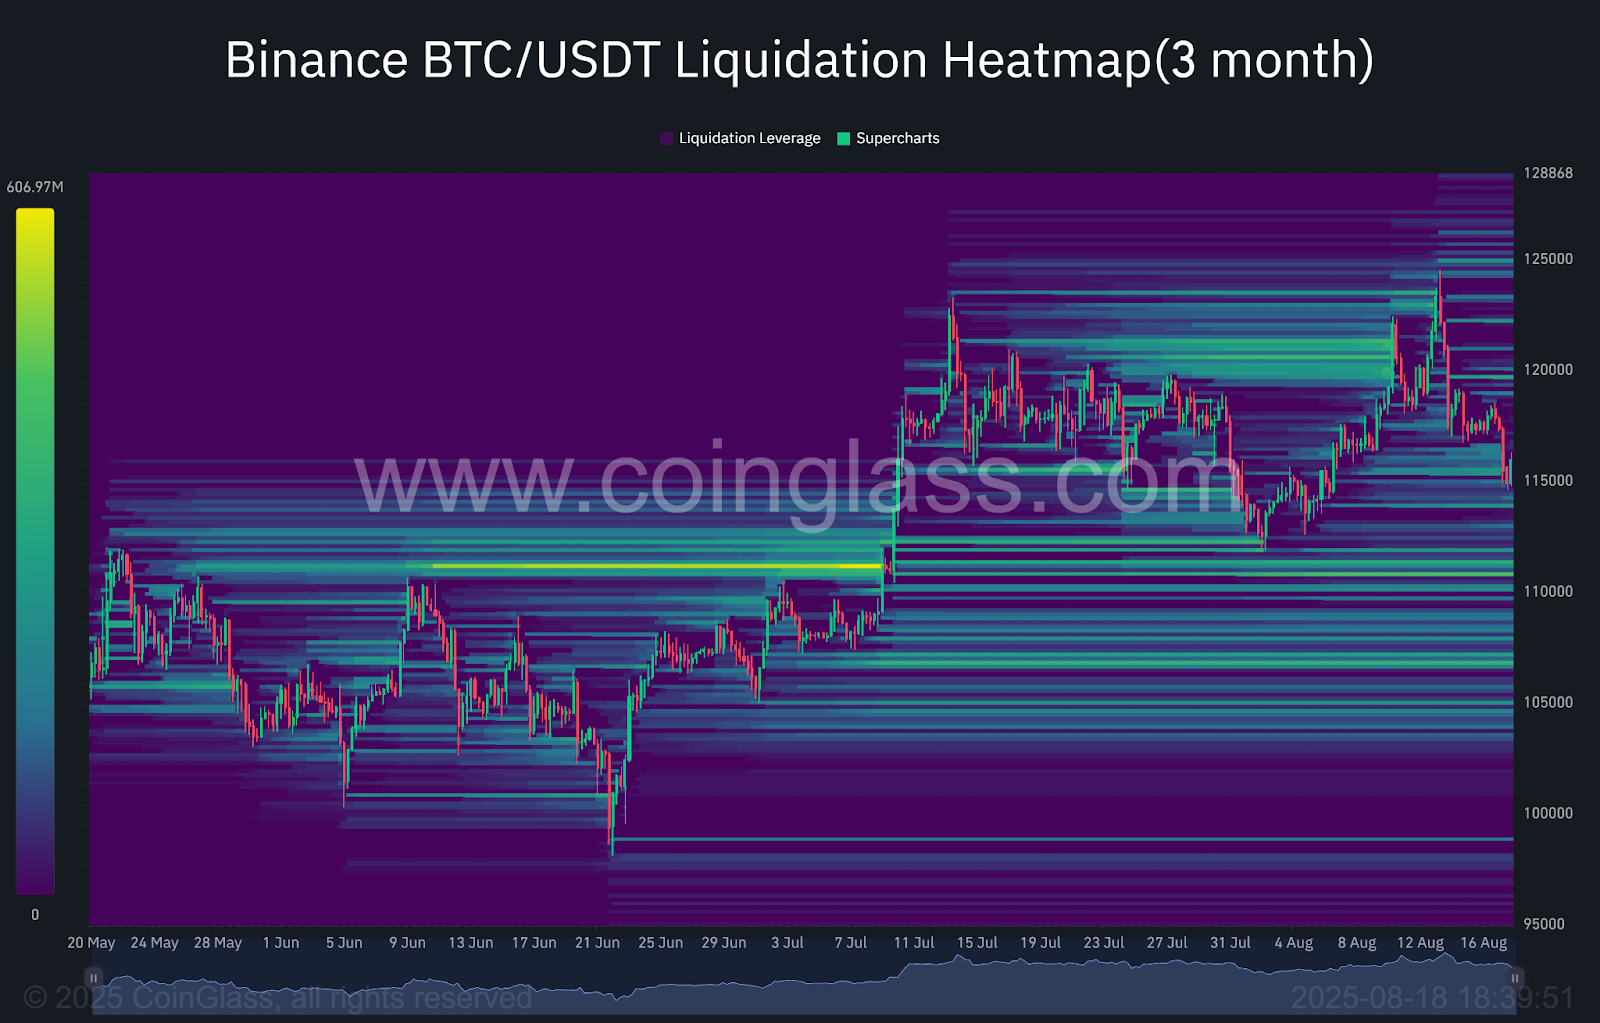
Selling liquidation areas are identified between $ 119,750 and $ 123,050, as well as $ 125,000. These levels constitute sensitive areas in the event of breakout Haussier, with a risk of amplification of the movement if the prices cross these thresholds. Up to decrease, several buying liquidation zones are identified around $ 111,000 as well as around $ 107,000 and then $ 105,000. These levels represent critical thresholds likely to cause flush -type movements if the market breaks these supports. All of these areas must be closely monitored, because they structure potential accelerations to come, whether in a more marked upward or correction scenario.
Forecasts for the Bitcoin course (BTC)
Haussier scenario:
- Conditions: maintenance above $ 11,900.
- Objectives: $ 124,533 (ATH) / $ 127,369 / $ 132,815.
- Potential: approximately 17 % increase since the current level.
Lower scenario:
- Conditions: breakdown of the support at $ 11,900.
- Objectives: $ 107,555 / $ 105,200 / $ 100,000
- Potential: approximately -12 % decrease since the current level.
Conclusion
Bitcoin evolves in a consolidation phase, where the solidity of the basic trend contrasts with short -term weaknesses. The dynamics remain generally upward, but the balance remains fragile, the sensitive areas which can quickly trigger marked movements. In this context, reactions to key technical thresholds and macroeconomic climate will be decisive, especially since the markets remain shaken by the idea that the Fed may not lower its rates in September.
Maximize your Cointribne experience with our 'Read to Earn' program! For each article you read, earn points and access exclusive rewards. Sign up now and start accumulating advantages.


