
After having crossed a new historic summit, Bitcoin marks a slight stabilization phase. Discover our complete technical analysis and the scenarios to monitor for the BTC.

In short
- Technical analysis: Bitcoin remains supported around $ 109,600, with increased volumes and a confirmed bias at all horizons.
- Technical levels: Bitcoin consolidates under resistance, near major technical levels, with a bias preserved above the old ATH.
- Market feeling: Euphoric market feeling with institutional influx supported via them and, confirming an appetite for risk.
- Analysis on derivatives: derivatives reflect a balanced market, with an overly interested open and a slight bias bias on the funding side.
- Forecasts: The bias remains bullish above $ 106,790, with potential to $ 112,000. In the event of a break, a withdrawal to $ 100,000 or even $ 92,700 remains possible, under the influence of the macro and geopolitical context.
BTC/USD technical analysis
| Spot price | $ 109,600 | Successful increase with the ancient Historical Summit (ATH). |
| Latest weekly variations | +2.42 % | Resumption after a slight consolidation phase. |
| Last weekly volumes | 44 B (+41 %) | Notable recovery of exchanges. |
| Long -term trend | Upward | Trendy solidly upward -oriented, confirming a positive basic dynamic. |
| Medium -term trend | Upward | Acceleration of upward dynamics in the medium term. |
| Short -term trend | Upward | Sustained increase phase, despite a slight recent shortness of breath. |
| Momentum | Resumption | Slight recovery of the dynamics, with persistent stabilization in the over -racket zone according to the oscillators. |
The Bitcoin Spot Prix is around $ 109,600, in a sustained increase dynamic marked by the crossing of the historic ancient. The weekly variation of +2.42 % reflects a recovery after a short consolidation phase, accompanied by a net revival of activity, with weekly volumes reaching $ 44 billion, up 41 %. On the technical level, the trend remains solidly upward in the long term (SMA 200), while the pace accelerates in the medium term (SMA 50), confirming a positive dynamic. In the short term (SMA 20), the increase phase continues, although certain signs of shortness of breath appear. The momentum shows a slight recovery, but remains in the Surachat zone, which suggests stabilization of dynamics rather than frank acceleration.
Bitcoin technical levels (BTC)
| Resistances | $ 110,500 & 112,000 (ATH) | Critical areas, potential distribution thresholds. |
| Support | $ 106,790 / $ 100,700 & $ 91,713 | Major defense levels, probable accumulation zones. |
| Last daily break | $ 109,346 (former ATH) | Historical resistance crossed, confirmed biases. |
| Monthly pivot | $ 88,177 | Reference level for the trend of the month, located under the current course. |
| High value area | $ 111,434 | High volume area; upper terminal of a market balance. |
| Low value area | $ 103,500 | High volume area; lower limit of a market balance. |
In a context of active consolidation under resistance, Bitcoin evolves near major technical levels, with a still constructive market structure. The resistors located at $ 110,500 and $ 112,000 (former ATH) constitute critical areas, likely to serve as distribution thresholds in the event of buyer exhaustion. Lowering, supports at $ 106,790, $ 100,700 and $ 91,713 represent significant defense levels, often associated with accumulation phases. The last daily break at $ 109,346 validates a bullish technical crossing of the historic ancient, reinforcing the positive bias in the short term. The monthly pivot point, located at $ 88,177, remains clearly below the current course, serving as a structural reference level. Finally, the volume profile highlights a high value area at $ 111,434, and a low value area at $ 103,500, delimiting a market balance beyond which a more marked imbalance could emerge.
Market feeling
| Market feeling (Fear & Greed Index) | Greed | Euphoric feeling which confirms the return of the appetite for the risk. |
| Flow ETF BTC Spot (net flows) | Significant influx | Institutional flows support the current trend. |
The market is evolving in a greed zone, a reflection of an euphoric feeling and a clear renewed appetite for the risk. The BTC Spot ETF record significant influx, indicating clear institutional support for current upward dynamics.
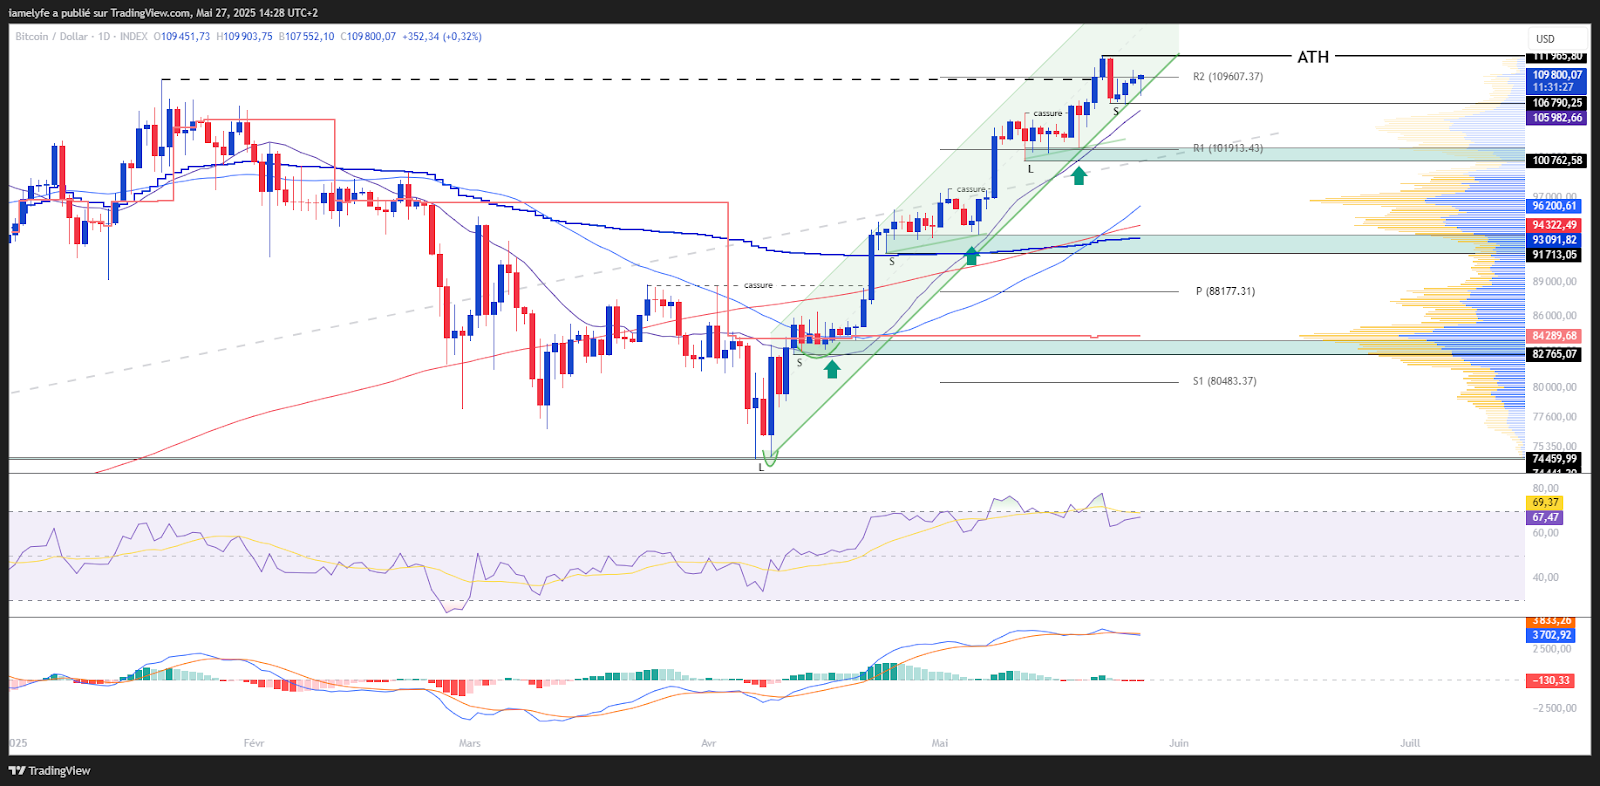
Current technical analysis was carried out in collaboration with ElyfeAnd 0xhugzerinvestors and popularizers on the cryptocurrency market.
Analysis on derivatives (BTC/USDT)
| Open Interest | Increase | Speculative positioning increasing, growing interest. |
| CVD | Balanced flow | Relatively stable flow, lack of marked imbalance. |
| Liquidation | Weak, without bias | Moderate and balanced liquidation activity, no significant directional pressure sign. |
| Funding Rate | slightly positive | Light bias bias, moderate bonus for long positions. |
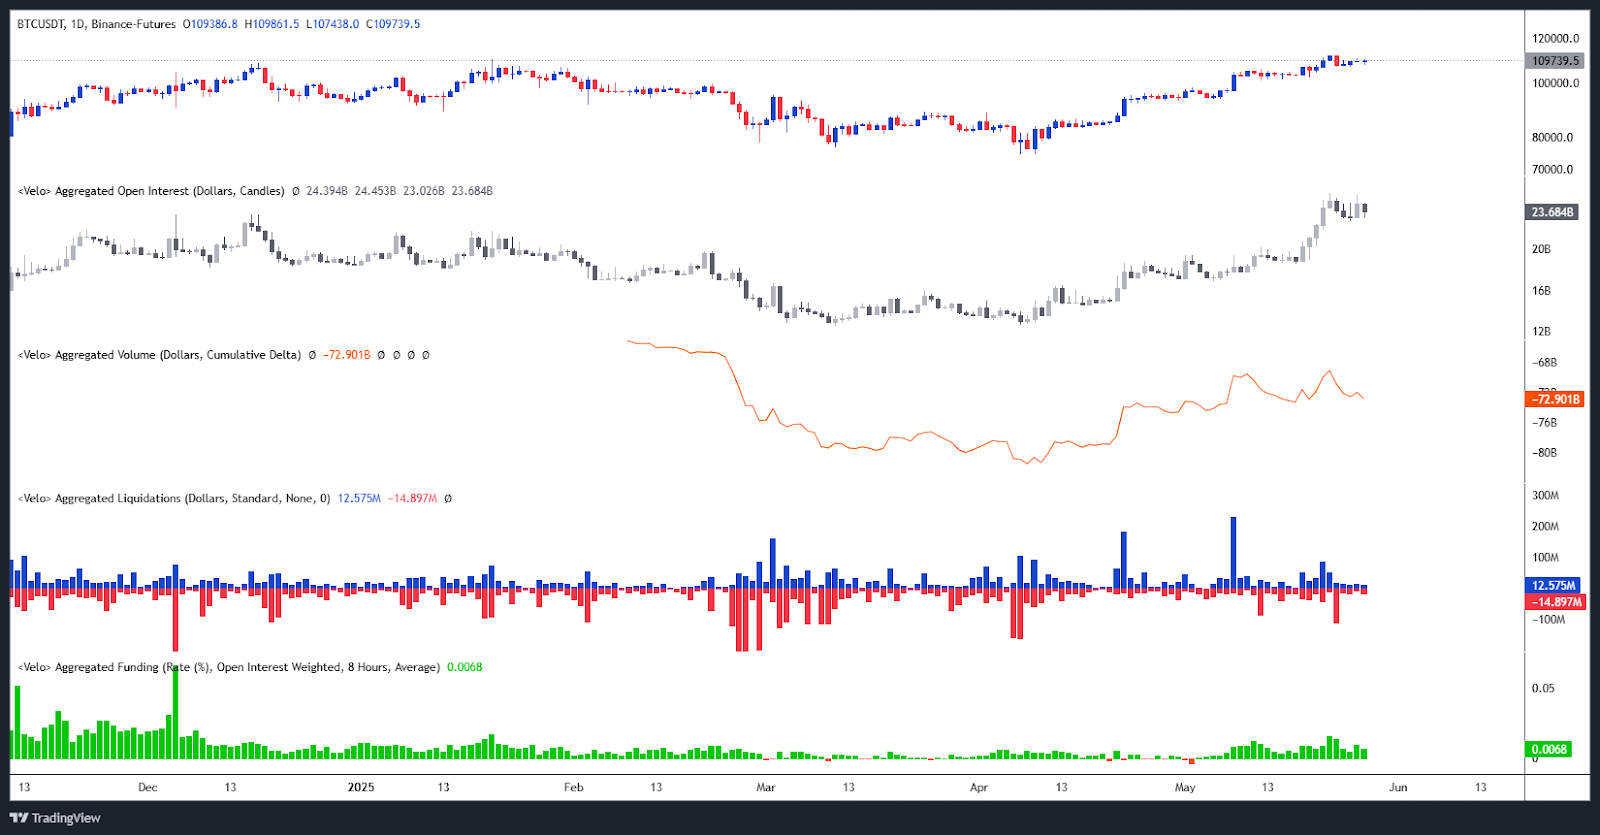
Derivative indicators offer balanced reading on the market. The Open Interest continues its increase, reflecting an increasing speculative interest in the long -term market. The CVD flows remain generally balanced, without net pressure signal between buyers and sellers. The liquidation activity remains moderate and without a marked directional bias, while the funding rate, slightly positive, suggests a slight advantage on the side of long positions.
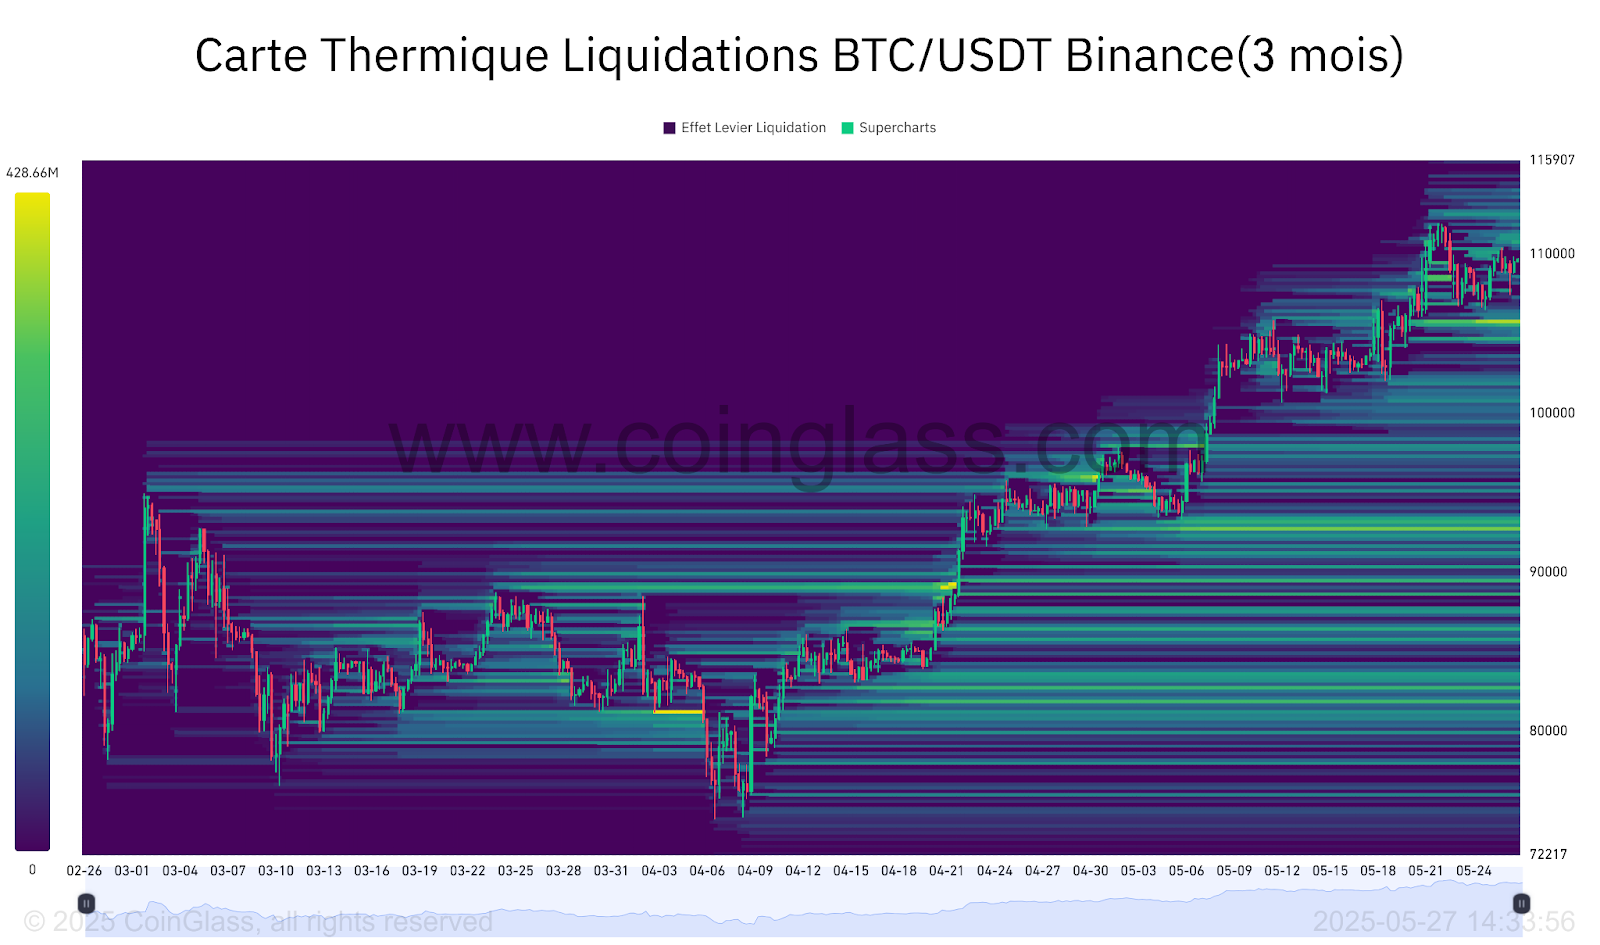
| Selling liquidation zone | ≈ $ 111,100 / ≈ $ 112,600 | Sensitive areas in case of breakout, risk of amplification of movement. |
| Buyer liquidation area | ≈ $ 106,000 / ≈ $ 93,000 | Decrease critical thresholds, potential flush areas. |
Bitcoin evolves between two major technical liquidation zones.
Uplining, the $ 111,11 100 zone at $ 112,600 corresponds to a cluster of selling liquidations; Its overtaking could serve as a catalyst for bullish acceleration. Lowering, the area between $ 106,000 and $ 93,000 is a fragility area, where increased sales pressure could lead to a forced liquidation movement.
Forecasts for the Bitcoin course (BTC)
Haussier scenario:
- Conditions: maintenance above $ 106,790.
- Objectives: $ 110,500 / $ 112,000 (ATH) / $ 113,600.
- Potential: approximately +3.5 % increase since the current level.
Lower scenario:
- Conditions: Break in support at $ 106,790.
- Objectives: $ 106,000 / $ 100,762 / $ 92,700.
- Potential: approximately -15 % decrease since the current level.
Comment :
The bias remains bullied, but the American macroeconomic indicators as well as the news related to the global geopolitical context will be decisive to confirm this scenario.
Conclusion
Bitcoin evolves in a positive dynamic, supported by a robust technical structure and a renewed speculative interest. Despite a consolidation phase under key levels, the bias remains bullish, carried by a balanced market context and a globally optimistic feeling. The current levels remain sensitive, and the evolution of the price will largely depend on the reactions around the technical pressure zones and the global macroeconomic climate. In this context, it will be essential to closely monitor the reaction of prices at strategic levels in order to confirm or adjust current forecasts.
Finally, remember that these analyzes are based solely on technical criteria, and that the course of cryptocurrencies can evolve quickly according to other more fundamental factors.
Has this study interested you? Find our latest Dogecoin analysis.
Maximize your Cointribne experience with our 'Read to Earn' program! For each article you read, earn points and access exclusive rewards. Sign up now and start accumulating advantages.