Ethereum has a rebound over 50 % in less than two weeks. Find our complete analysis and the current technical perspectives of ETH.

In short
- Technical analysis: ETH in strong acceleration: carried by a weekly increase of +38.5 % and volumes in flight (+154 %), ETH displays a solid upward dynamic on all horizons, despite moderate clearances on ETF Spot.
- Key levels: ETH remains bullish above $ 2,105, supported by key levels at $ 2,407, $ 1,723 and $ 1,471, but approaches a dense resistance area between $ 2,740 and $ 3,746, with a market balance framed between $ 1,630 below and $ 3,325 at the top.
- Derivative analysis: Market signals remain bruise, between the rise of open interest, seller absorption and short liquidations, but increased funding calls for vigilance in the event of continuous progression.
- Forecasts: The bias remains bullied above $ 2,407, with a potential of +30 %, but a rupture would expose the market to a correction which can reach -45 %, depending on the impact of the macroeconomic factors to come.
ETH/USD technical analysis
| Indicator | State | Comment |
| Spot price | $ 2,625 | Strong bullish extension after crossing key levels. |
| Latest weekly variations | + 38.5 % | The price marked its largest weekly increase in the year, an upward acceleration signal. |
| Last weekly volumes | 31.3 billion (+154%) | Flight of the volumes, in line with the vigor of the Haussier movement. |
| Long -term trend (SMA 200) | Upward | Gradual increase in the long -term trend. |
| Medium -term trend (SMA 50) | Upward | Upward structure installed in the medium term. |
| Short -term trend (SMA 20) | Upward | Sustained increase, no sign of immediate weakness. |
| Momentum | Increase | Momentum confirms its increase, with clear acceleration oscillators. |
| ETH ETH Spot flow (net flows) | Moderate clearances | The ETFs show moderate release, signaling a measured withdrawal of the interest buyer institutional. |
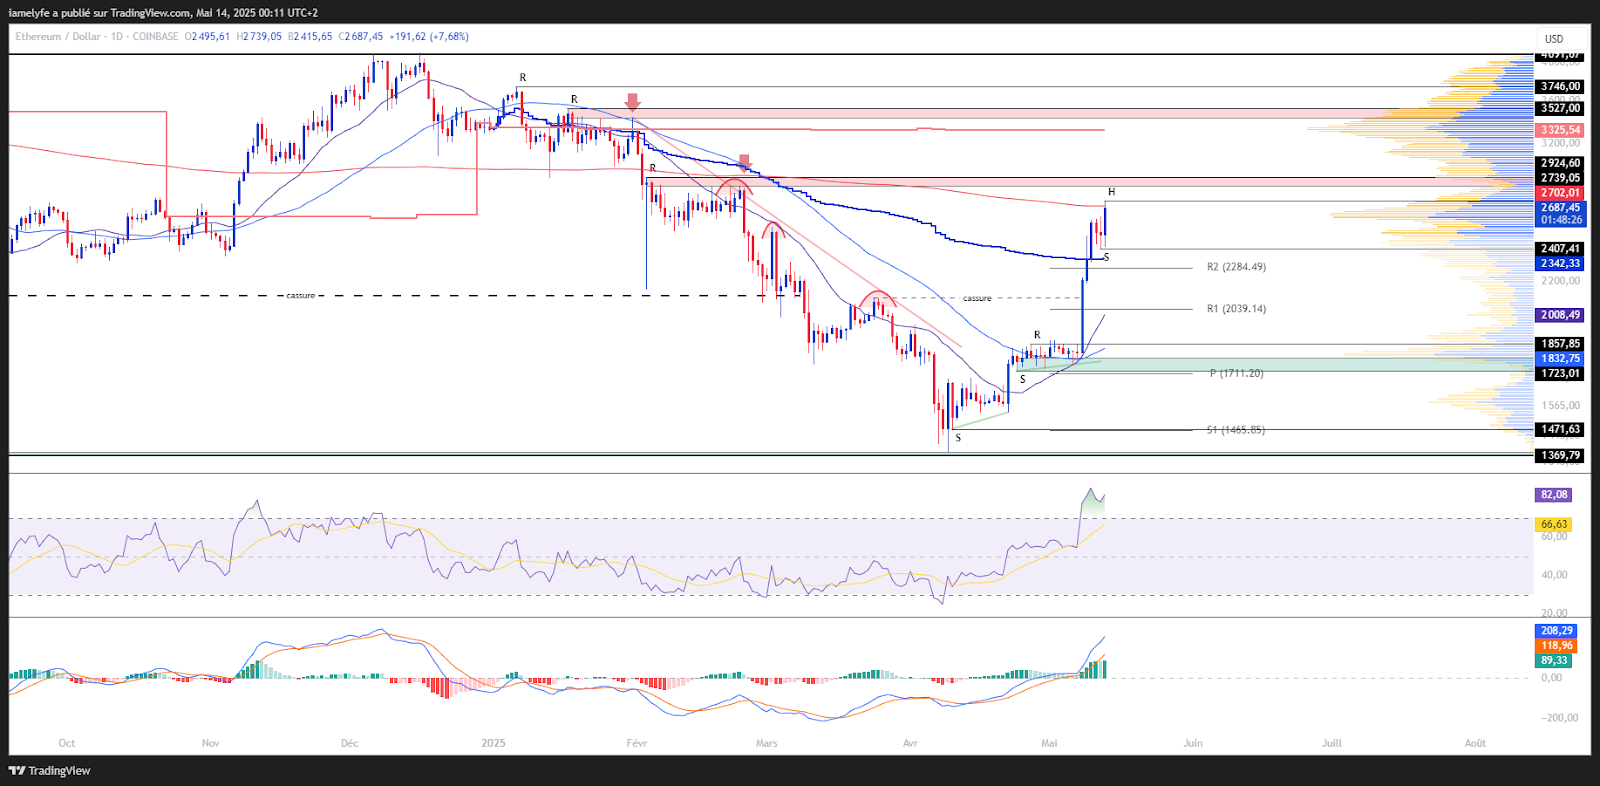
ETH displays a strong recovery with a spot price at $ 2,625, carried by a weekly increase of +38.5 %, the largest of the year. This increase is accompanied by a flight of volumes (+154 %), reflecting a revival marked with participation. Trends are now up on all horizons (SMA 20, 50 and 200), indicating a well -established structural dynamic. The momentum remains powerful, with net acceleration oscillators, confirming the solidity of the movement. The only notable reserve: moderate clearances on ETH ETH Spot, signaling a measured withdrawal of the Institutional buyer interest.
Ethereum key levels
| Indicator | State | Comment |
| Resistance | $ 2,740 / $ 2,924 / $ 3,527 – $ 3,746 | Critical areas, potential distribution thresholds. |
| Support | $ 2,407 / $ 1,723 / $ 1,471 | Major defense levels, probable accumulation zones. |
| Last daily break | $ 2,105 | Resistance crossed; Confirmation of the bias bias. |
| Monthly pivot | $ 1,711 | Reference level for the trend of the month below the course. |
| High value area | $ 3,325 | High volume area; Upper terminal of a market balance, beyond which an imbalance can emerge. |
| Low value area | $ 1,630 | High volume area; Low limit of a market balance, beyond which an imbalance can emerge. |
Ethereum remains registered in an upward dynamic confirmed by the recent daily break at $ 2,105, with well identified support levels at $ 2,407, $ 1,723 and $ 1,471, likely to serve as accumulation areas in the event of withdrawal. The monthly pivot point at $ 1,711 is a reliable trend mark, always located under the market. As key resistors are approaching between $ 2,740 and $ 3,746, the price is close to thresholds likely to cause profits or slowdown. Two very distinct zones of value frame the cryptocurrency: a $ 1,630, supporting the idea of a solid buyer base, and a more than $ 3,325, marking a possible limit to progression, beyond which an imbalance could emerge.
Current technical analysis was carried out in collaboration with ElyfeAnd 0xhugzerinvestors and popularizers in the cryptocurrency market.
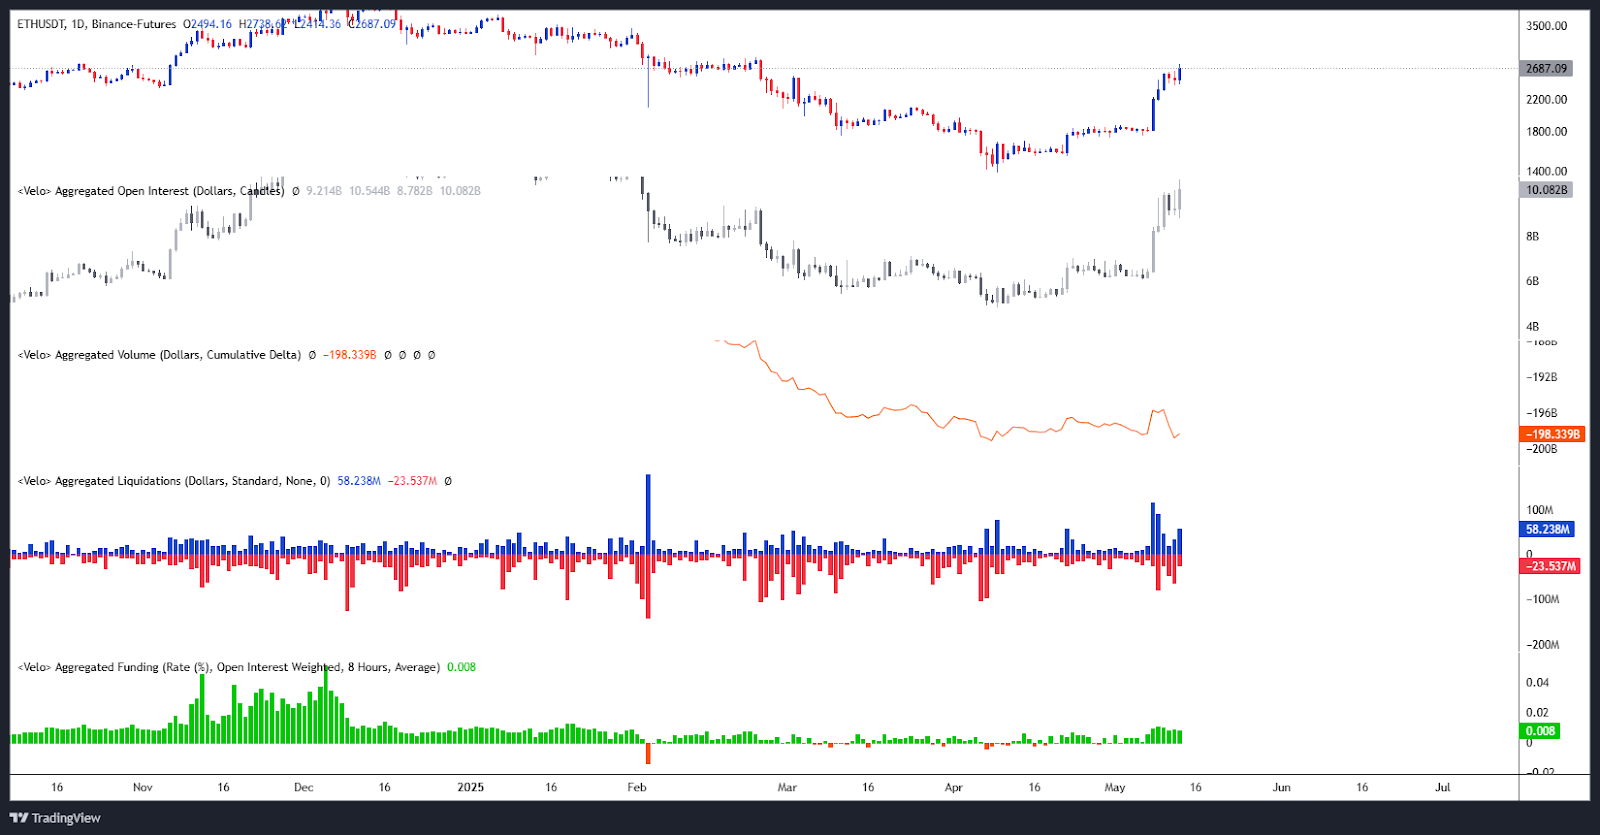
Analysis on derivatives (ETH/USDT)
| Indicator | State | Comment |
| Open Interest | Increase | Speculative activity in progress, testifying to a renewed interest |
| CVD | TRADE ABSERMENT | Divergence showing the presence of sellers, absorbed by passive buyers |
| Liquidation | Strong, side side | Notable liquidations on the short side, a sign of capitulation of the sellers. |
| Funding Rate | slightly positive | Moderately high funding rate, reporting a bias bias, without marked speculative excess. |
Market data indicate an environment generally favorable to buyers, although without excessive euphoria. The increase in open interest has resolved a boost of speculative activity, while the CVD highlights a selling absorption, a sign of discreet, but active support. The wave of liquidations on the short side suggests a capitulation of the sellers, mechanically strengthening the upward dynamics. Funding sponsors, positive and growing, reflects an increasing buyer bias; An evolution to be monitored, because an excess of leverage could weaken the dynamics in the event of a sudden drop in the market.
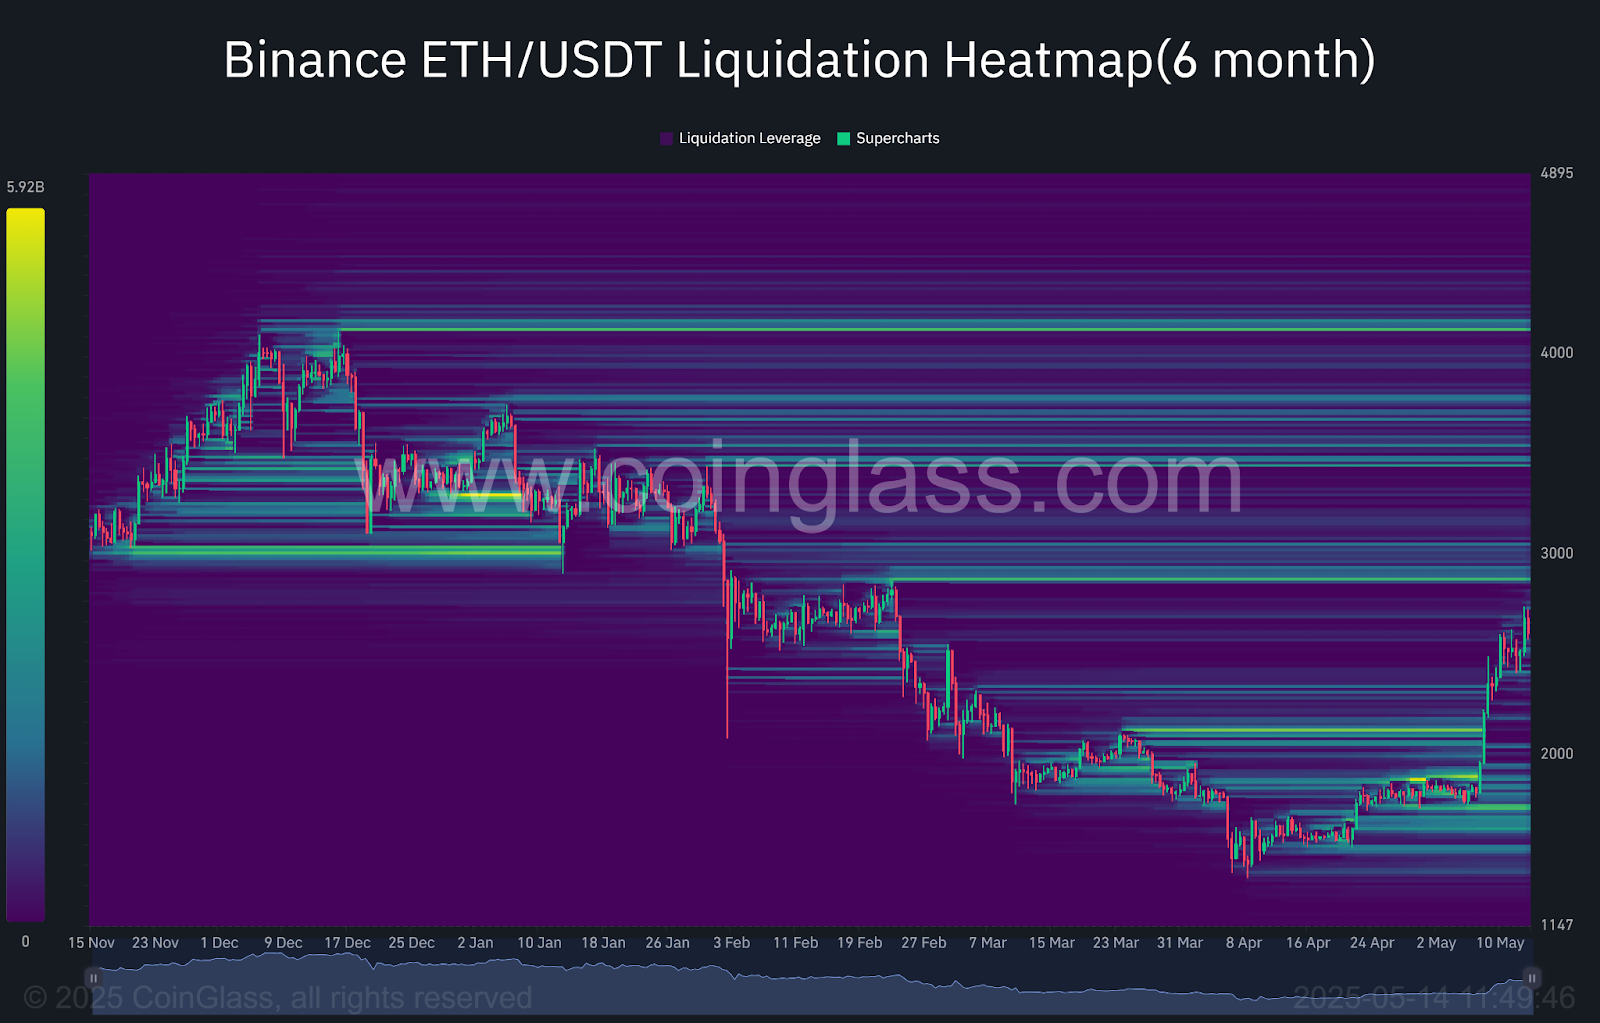
| Indicator | State | Comment |
| Selling liquidation zone | ≈ $ 2,850 – $ 3,050 / $ 3,424 – $ 3,790 / $ 4,244 – $ 4,250 | Sensitive areas in case of breakout, risk of upward amplification. |
| Buyer liquidation area | ≈ $ 2416 – $ 2,370 / $ 1,906 – $ 1,865 / $ 1,835 – $ 1,605 / $ 1,537 – $ 1,500 | Decrease critical thresholds, potential flush areas. |
The market identifies several selling liquidation areas located between $ 2,850 and $ 3,050, $ 3,424 and $ 3,790, as well as $ 4,124 and $ 4,250. These levels constitute sensitive areas in case of breakout, which can cause upward amplification if they are crossed with volume.
Conversely, the buying liquidation zones are more numerous and more extensive, covering the beaches from $ 2,416 to $ 2,370, $ 1,906 to $ 1,865, $ 1,835 to $ 1,605, and $ 1,537 at $ 1,500. These thresholds represent decreasing critical areas, where the market is exposed to significant risk of flush in the event of rapid correction.
Forecasts for the Ethereum (ETH) course
Haussier scenario:
- Conditions: maintenance above $ 2,407.
- Objectives: $ 2,739 / $ 2,925 / $ 3,527.
- Potential: +30 % since the current level.
Lower scenario:
- Conditions: Break in support at $ 2,407.
- Objectives: $ 2,110 / $ 1,723 / $ 1,471.
- Potential: decrease of up -45 %.
Comment :
The bias remains bullied, without however excluding a possible short -term correction. The macroeconomic indicators to come, as well as the speech of Jerome Powell, could play a key role in the validation or invalidation of this scenario.
Conclusion
Ethereum evolves in a clearly bullish context, carried by a strong participation and a solid technical dynamic. The market structure remains favorable, with well -established support areas and short -term monitoring resistance. The data from the derivative markets confirm a renewed buyer interest, without significant excess. The bias remains positive, although a technical withdrawal cannot be excluded in the event of punctual pressure. In this context, it will be essential to closely monitor the reaction of prices at strategic levels in order to confirm or adjust current forecasts.
Finally, remember that these analyzes are based solely on technical criteria, and that the course of cryptocurrencies can evolve quickly according to other more fundamental factors.
Has this study interested you? Find our latest Bitcoin analysis.
Maximize your Cointribne experience with our 'Read to Earn' program! For each article you read, earn points and access exclusive rewards. Sign up now and start accumulating advantages.