

Bitcoin begins a promising recovery: find our complete analysis and the current technical perspectives of the BTC.

In short
- BTC/USD technical analysis: Bitcoin consolidates under a key resistance after a strong rebound (+ 10 %), with increased volumes and a confirmed upward trend on all time units.
- Analysis of derivatives (BTC/USDT): Speculative activity takes up, with an increase in “open interest”, a domination of buyers, a “Squeeze shorts” and a moderately positive funding rate.
- Forecasts for the Bitcoin course (BTC): Haussier Validated scenario if BTC remains above $ 91,600, with objectives up to $ 109,354; Below this threshold, correction risk to $ 74,500.
- The technical context remains favorable, but market reactions to key areas and macroeconomic data will be decisive for the future.
BTC/USD technical analysis
| Indicator | State | Comment |
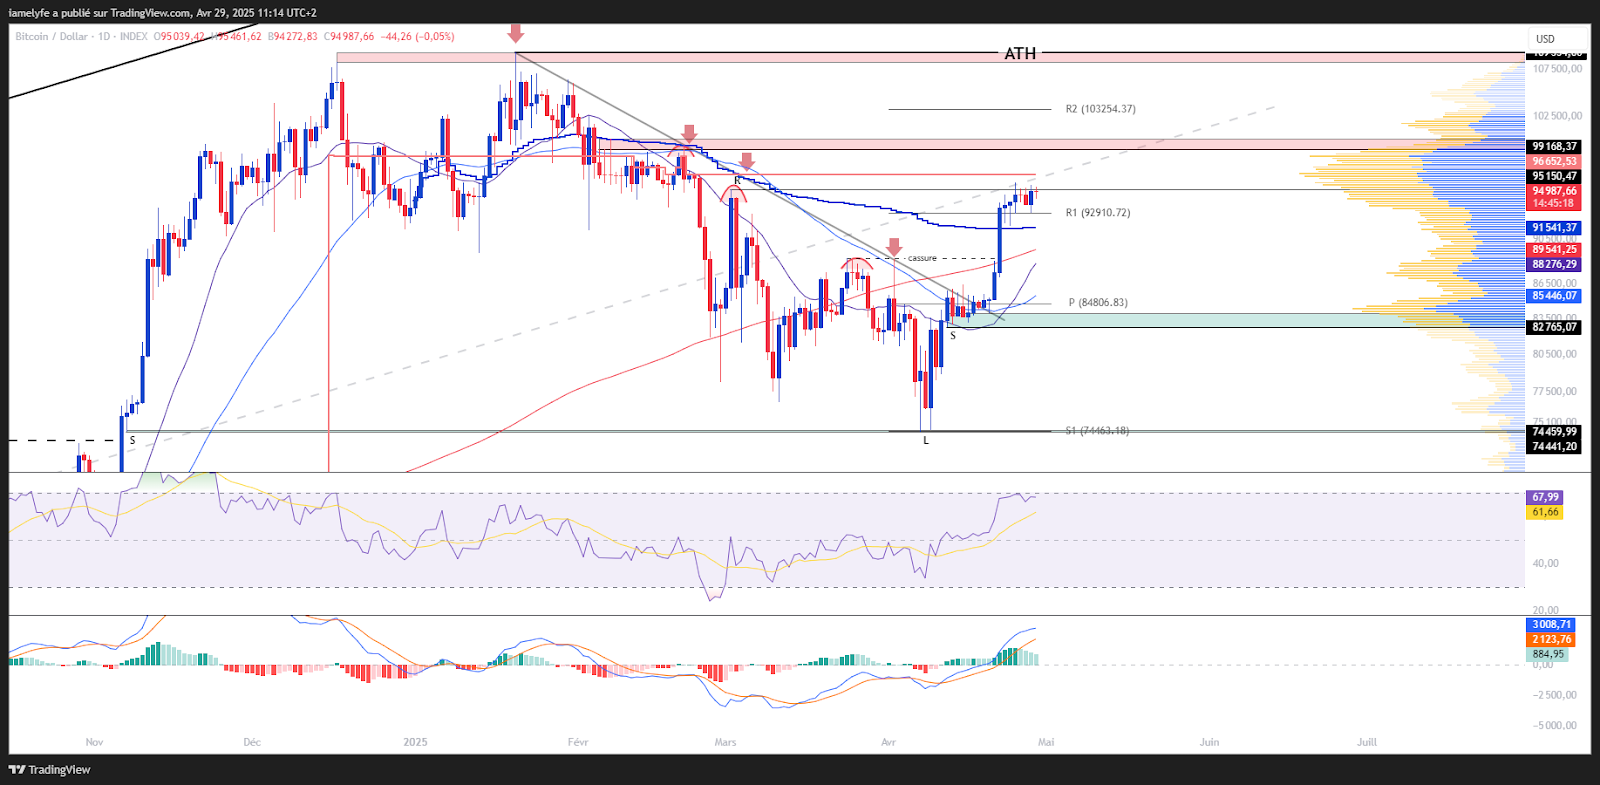
| BTC spot price | $ 94,925 | Consolidation under key resistance at $ 95,150; Technical threshold to be monitored for upward confirmation. |
| Latest weekly variations | + 10.17 % | Major technical rebound, stronger weekly progression since November 2024. |
| Last weekly volumes | 35 billion (+73%) | Significant activity of activity, validates the resumption of momentum. |
| Long -term trend (SMA 200) | Upward | Intact trend, supporting a positive long term bias. |
| Medium -term trend (SMA 50) | Upward | Confirmed upward reversal signals. |
| Short -term trend (SMA 20) | Upward | Complete alignment of averages in favor of Bulls. |
| Momentum | Resumption | Technical divergence indicating a potential for continuing movement. |
| Resistances | $ 95,150 / $ 100,000 | Critical areas, potential distribution thresholds. |
| Support | $ 82,750 / $ 78,500 | Major defense levels, probable accumulation zones. |
| Value area | $ 96,600 / $ 67,350 | Liquidity and probable market balance on the market. |
| Market feeling (Fear & Greed Index) | Greed | Euphoric feeling which confirms the return of the appetite for the risk. |
| Flow ETF BTC Spot (net flows) | Significant influx | Institutional flows support the current trend. |
Bitcoin is currently consolidating under the key resistance of $ 95,150, after having recorded its strongest weekly increase (+10.17 %) since November 2024. The rebound in weekly volumes (+73 %) testifies to a net recovery of activity. The trend remains upward on all horizons (short, medium and long term), confirmed by the position of the mobile averages (SMA 20, 50 and 200) and by an upward divergence signal on the Momentum. The main resistors are $ 95,150 and $ 100,000, while major supports are identified between $ 82,750 and $ 78,500. The value area is between $ 96,600 and $ 67,350. The market feeling is oriented towards greed and incoming flows on Bitcoin Spot ETF are increasing sharply, strengthening the upper dynamic.
Current technical analysis was carried out in collaboration with Elyfeinvestor and popularizer in the cryptocurrency market.
Analysis on derivatives (BTC/USDT)
| Indicator | State | Comment |
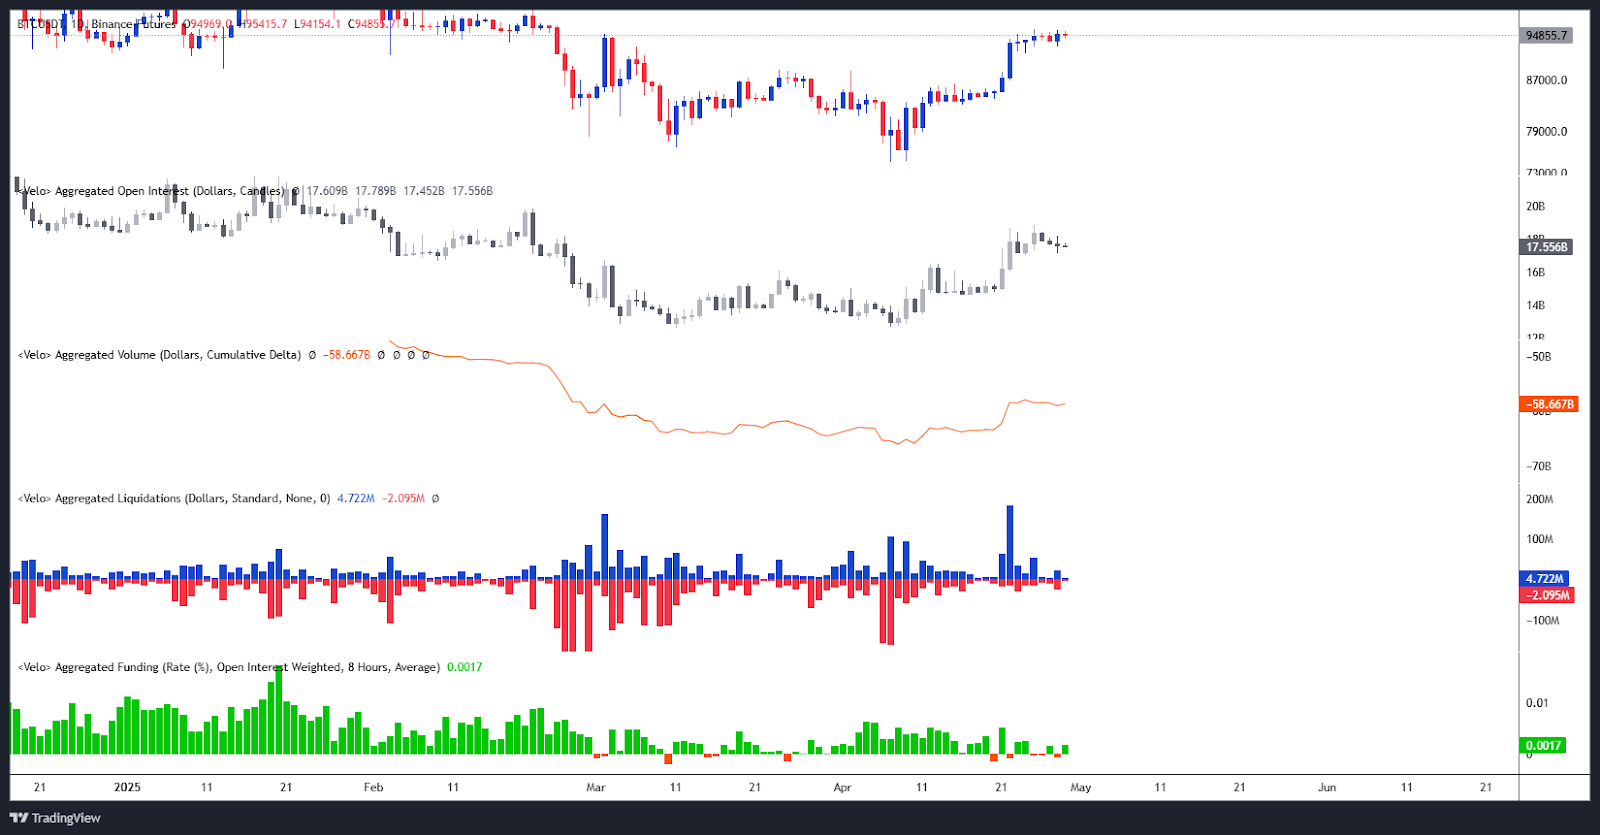
| Open Interest | Increase | Return of speculative activity, validates the bullish conviction. |
| CVD | Buyer dominance | Buyers regain the hand, possible bull lever effect. |
| Liquidation | Strong, side side | Squeeze on uncovered sellers, potential increase in increase. |
| Funding Rate | Slightly positive | Bullish positioning, but not extreme, not overheating. |
On BTC/USDT derivatives, there is an increase in open interest, reflecting a renewed speculative interest after a stability phase. The CVD is rebounded, reporting a recent predominance of buyers. Strong liquidations have been recorded on the side of the shorts, which confirms upward pressure of the market. The Funding Rate is slightly positive, which reflects a moderate buying demand without excess of optimism.
| Indicator | State | Comment |
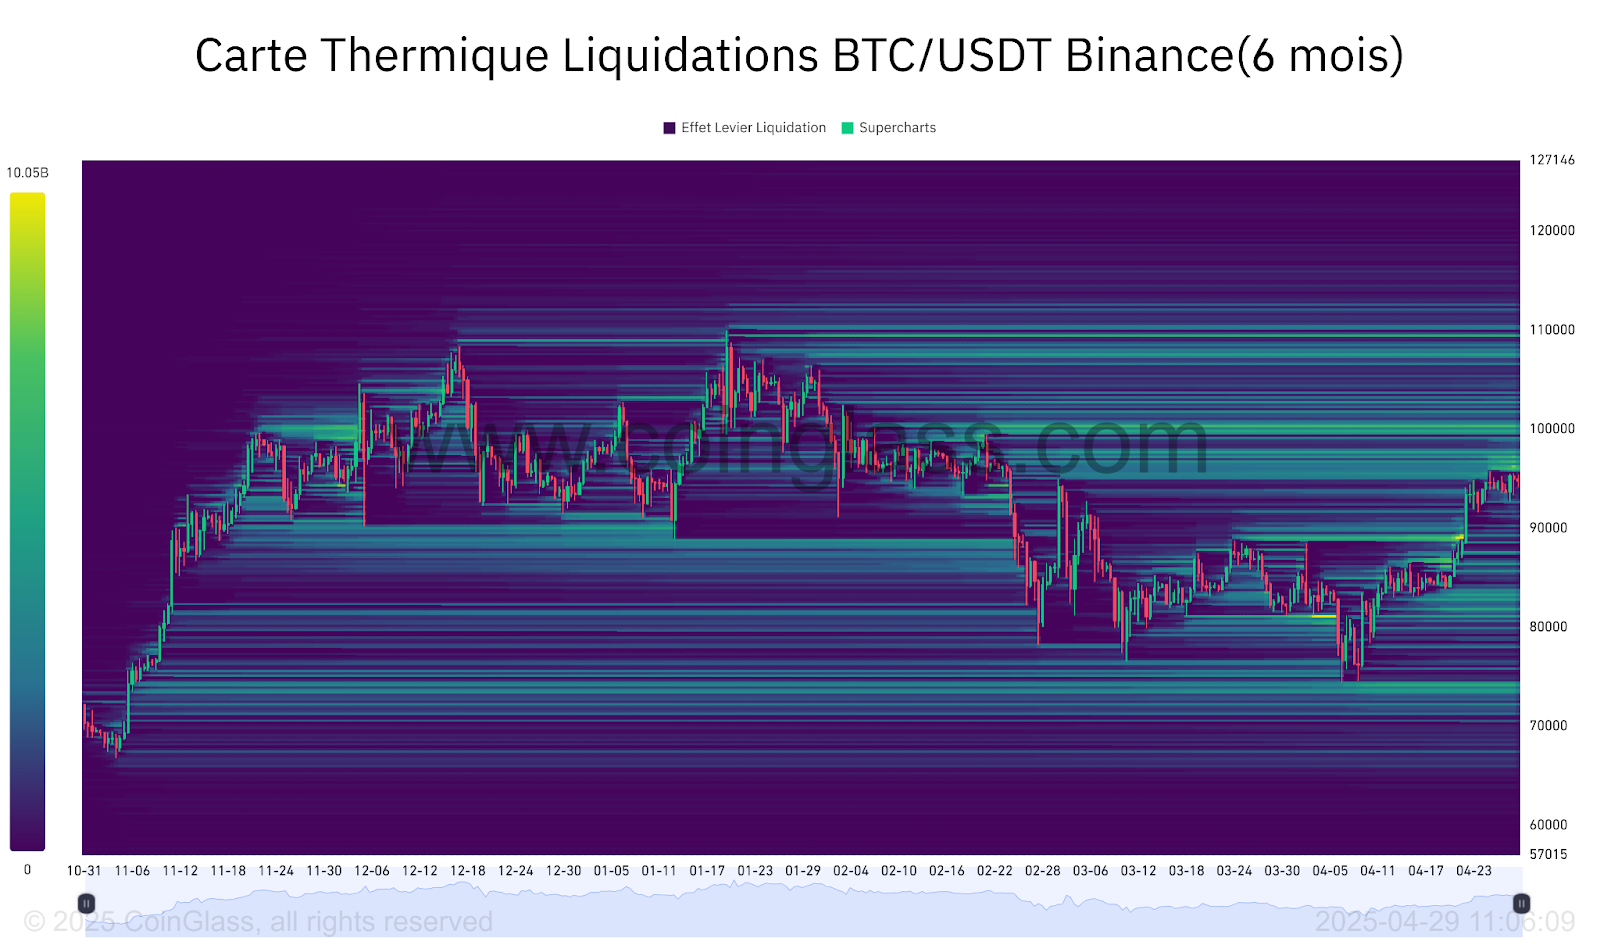
| Selling liquidation zone | ≈ $ 96,000 – $ 98,000 / $ 100,000 & $ 107,400 | Sensitive areas in case of breakout, risk of amplification of movement. |
| Buyer liquidation area | ≈ $ 84,000 – $ 81,000 / $ 74,400 – $ 73,400 | Decrease critical thresholds, potential flush areas. |
The main selling liquidation zones are located between $ 96,000 and $ 98,000, as well as proximity to $ 100,000 and $ 107,400, constituting critical levels likely to amplify up bullish acceleration. Conversely, the main buying liquidation zones are between $ 84,000 and $ 81,000, then between $ 74,400 and $ 73,400, the latter representing a strategic threshold in the event of an extended correction in the absence of buyer support.
Forecasts for the Bitcoin course (BTC)
Haussier scenario:
- Conditions: maintenance above $ 91,600.
- Objectives: $ 95,150 / $ 100,000 / $ 107,000 / ATH at $ 109,354.
- Potential: approximately +15 % since the current level.
Lower scenario:
- Conditions: Break in support at $ 91,600.
- Objectives: $ 84,000 / $ 82,700 / $ 81,300 / $ 79,000 / $ 74,500.
- Potential: decrease of up -21 %.
Comment :
The bias is currently bullish, but the approach of American economic data (GDP, PCE) will be decisive to validate this scenario.
Conclusion
Bitcoin evolves in an upward dynamic carried by a solid technical recovery and a renewed market interest. The trend remains positive as long as major support levels hold. Particular attention must be paid to price reactions to key areas and macroeconomic factors that could quickly influence market management. In this context, it will be essential to closely monitor the reaction of prices at strategic levels in order to confirm or adjust current forecasts.
Finally, remember that these analyzes are based solely on technical criteria, and that the course of cryptocurrencies can evolve quickly according to other more fundamental factors.
Maximize your Cointribne experience with our 'Read to Earn' program! For each article you read, earn points and access exclusive rewards. Sign up now and start accumulating advantages.


