After reaching a new all-time high above $100,000, Bitcoin came under selling pressure, causing its price to fall by more than 12%. Let's examine the prospects for the development of BTC.

Bitcoin (BTC) price situation
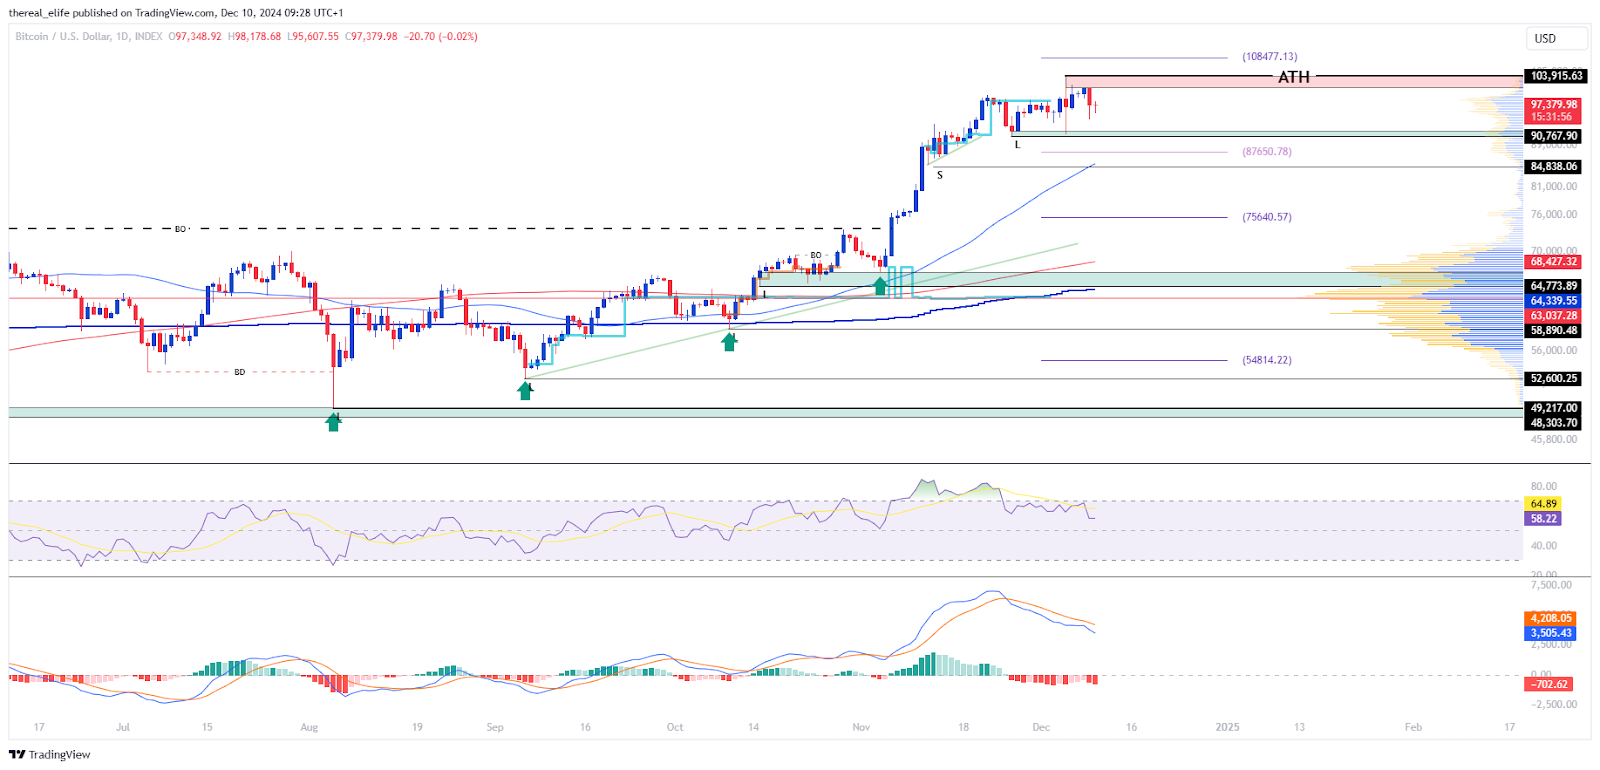
After bouncing on the support of $90,800Bitcoin gradually continued its rise until reaching a new all-time high, just below the $104,000. Unfortunately, reaching this level subsequently led to a selling movement, bringing its price, on the same day, just above the $91,000. Although worrying, the price of BTC rebounded again, confirming the importance of this support level. He thus joined the $101,400 before suffering a further decline, until the $94,600.
At the time of writing, the price of Bitcoin is trading around $97,100. Although the short-term trend of BTC is not clearly bullish, the medium and long-term structure remains clearly positive. This observation is reinforced by the positioning of the 50 and 200 day moving averages, which remain oriented and crossed upwards. Unsurprisingly, the cryptocurrency's bullish momentum continues to show signs of running out of steam and demonstrates a divergence with its price. This phenomenon may signal a possible downward reversal. However, let's not forget that Bitcoin has recently benefited from strong bullish volatility. This is often a harbinger of a break, or even a correction to come, while remaining a healthy development.
The current technical analysis was carried out in collaboration with Elie FT, a passionate investor and trader in the cryptocurrency market. Today trainer at Family Tradinga community of thousands of own-account traders active since 2017. You will find Lives, educational content and mutual assistance around the financial markets in a professional and warm atmosphere.
Focus on derivatives (BTC/USDT)
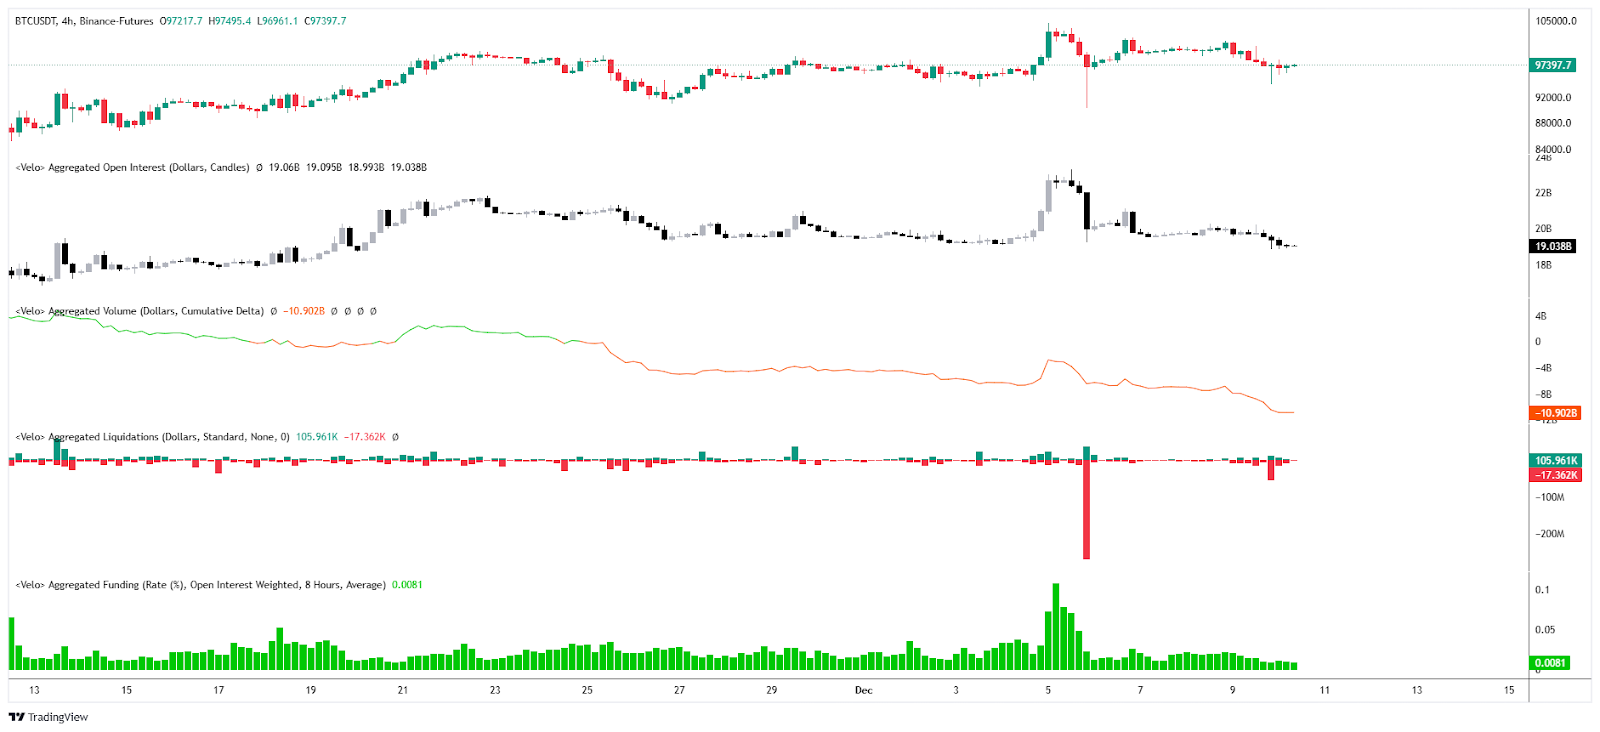
The open interest of BTC/USDT perpetual contracts has moved in line with the price of its underlying. This reflects a lack of new capital inflows and a notable closing of speculative positions. On the CVD side, it continues to fall, suggesting selling interest on the latest orders placed on the market. Concerning the financing rate, we observe that the size of buying positions remains greater than that of sellers. However, the indicator is showing signs of slowing down. Finally, on the liquidation side, these remain low, testifying to a balanced market where buyers and sellers seem to accept the current direction of the crypto. Nevertheless, it is worth noting that December 5 resulted in liquidations of long positions reaching $267 million, the largest liquidation since August 17, 2023. This demonstrates a forced capitulation of late buyers.
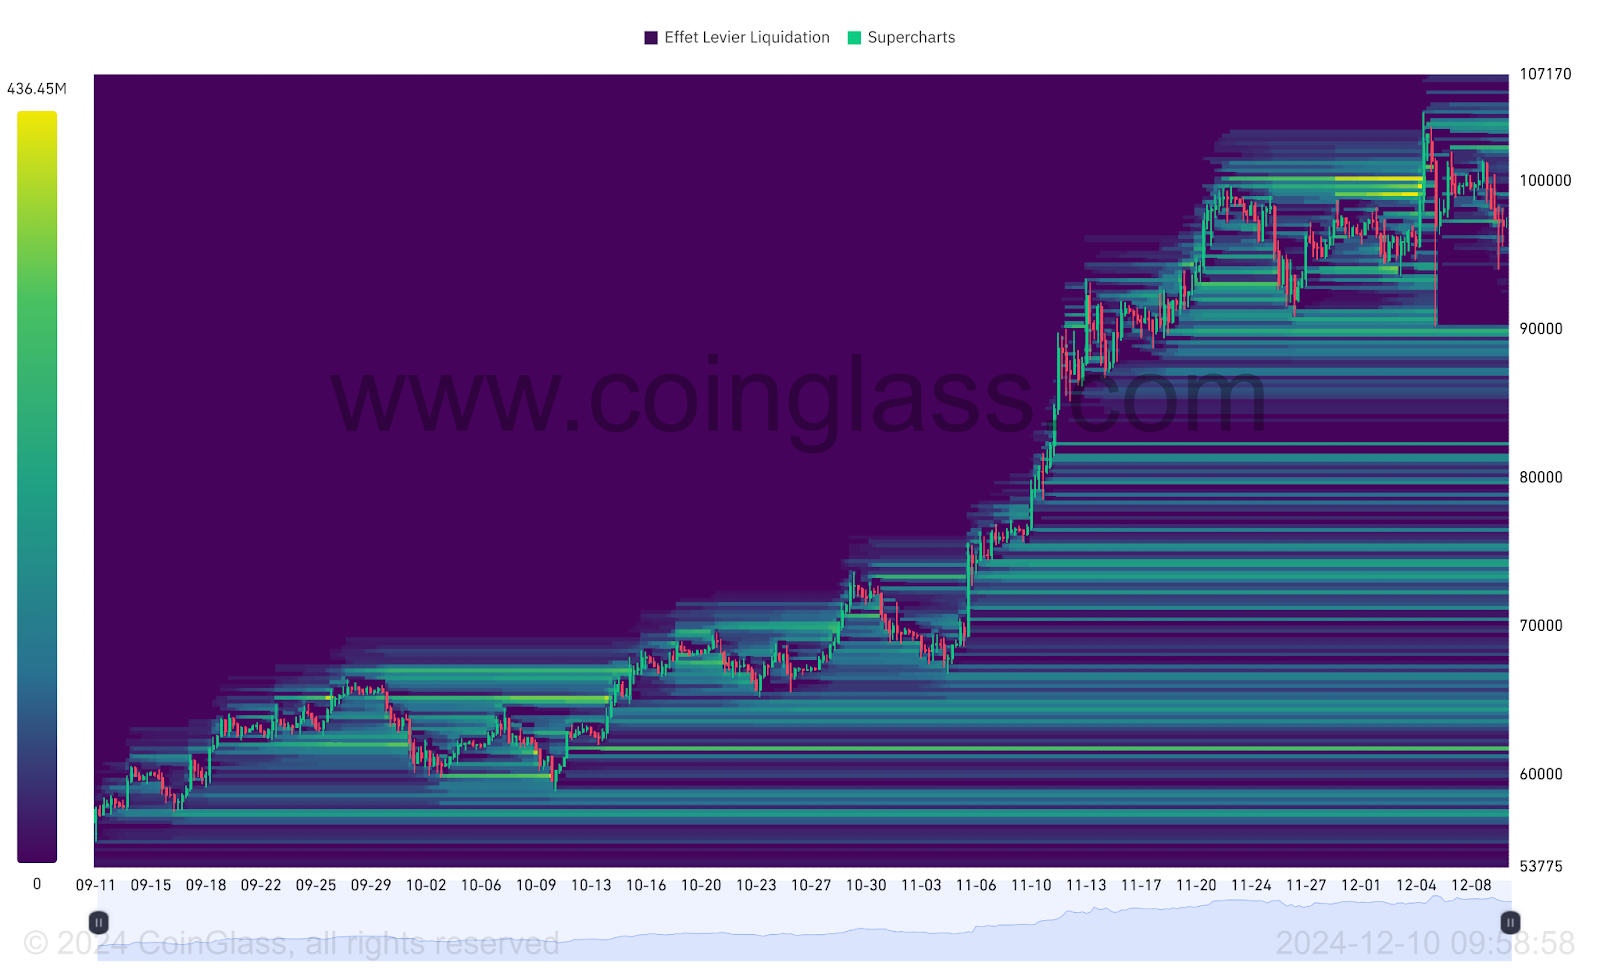
The heat map of BTC/USDT perpetual contract liquidations shows that Bitcoin has crossed a liquidation zone around the $100,000, before falling quickly towards a second notable zone located around the $90,000. Buying interest appears to have manifested at this level, leading to a rebound in the price. Currently, the crypto sits between two liquidation zones: above, a subtle zone is visible just below the $105,000while below, a notable area lies below the $90,000extending to $85,000. Further down, a subtle zone appears around the $80,000followed by a more marked area between $74,000 And $75,000. If the price approaches these levels, it could trigger a large number of orders, increasing the risk of volatility for the cryptocurrency. These areas therefore constitute crucial points of interest for investors.
Bitcoin (BTC) price forecasts
- If the price of Bitcoin manages to stay above $90,800a break in the resistance of $101,400 see $102,000 could happen. In this case, the continuation of the bullish movement could make it possible to reach the ATH of BTC, identified just below the $104,000. Crossing this last level would open the way towards the first resistance of the pivot points, located at $108,477. This would represent an increase of approximately 11%.
It is important to note that hitting an all-time high makes it more difficult to identify resistance levels.
- If Bitcoin fails to stay above $90,800he could find a point of support around $87,000. A prolonged decline could then lead towards support for $85,000. Finally, in the event of a more marked correction, the area located around $81,500 would constitute a key support, the achievement of which could lead to a drop of approximately 16%.
Conclusion
Despite marked fluctuations and signs of short-term slowdown, the overall Bitcoin trend remains positive, suggesting a healthy development despite possible corrections to come. Thus, it will be crucial to carefully monitor price reaction at key levels to validate or adjust current forecasts. Finally, remember that these analyzes are based solely on technical criteria, and that the price of cryptocurrencies can evolve quickly depending on other more fundamental factors.
Maximize your Tremplin.io experience with our 'Read to Earn' program! For every article you read, earn points and access exclusive rewards. Sign up now and start earning benefits.