Ethereum price ended the second week of December on a negative note, recording a decline of 6% and appears to continue its downward movement. Let’s take a look at the future prospects for the ETH price.
Status of Ethereum (ETH)
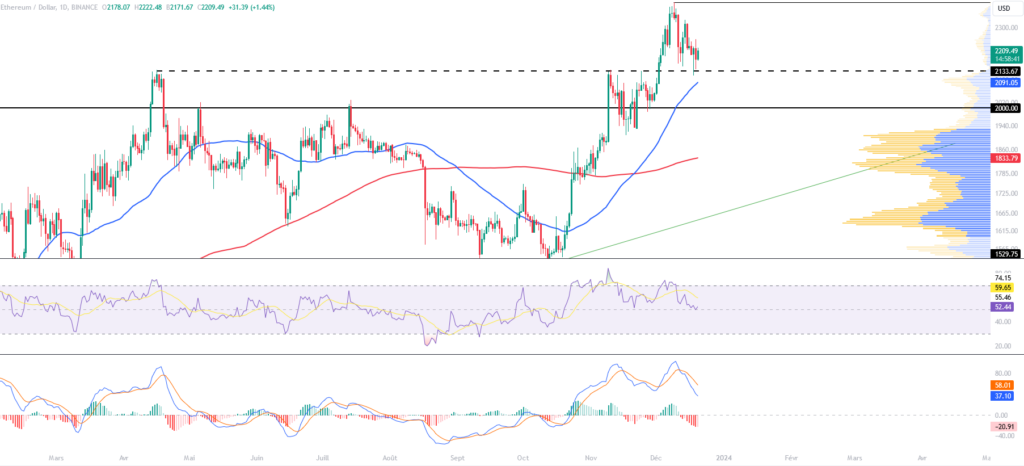
After reaching a new annual high of $2,400 at the start of the month, the price of Ethereum suffered a drop of around -10%. It was at the $2,140 level that Ethereum tried to recover. It is worth noting that this last level was the old high, taken into account since the beginning of 2023. Now, ETH seems to be consolidating and gaining pressure, forming a small descending wedge.
This morning, Ethereum is trading around $2,200. It is above its 50-day and 200-day moving averages, which continue to trend upward, supporting Ethereum’s medium-to-long-term uptrend. As for the oscillators, we observe that they still indicate bullish dynamics. However, a daily divergence is increasing. Thus, this suggests a period of consolidation or correction that should not be overlooked.
The current technical analysis was carried out in collaboration with Elie FT, a passionate investor and trader in the cryptocurrency market. Today trainer at Family Tradinga community of thousands of own-account traders active since 2017. You will find Lives, educational content and mutual assistance around the financial markets in a professional and warm atmosphere.
Focus on derivatives (ETHUSDT)
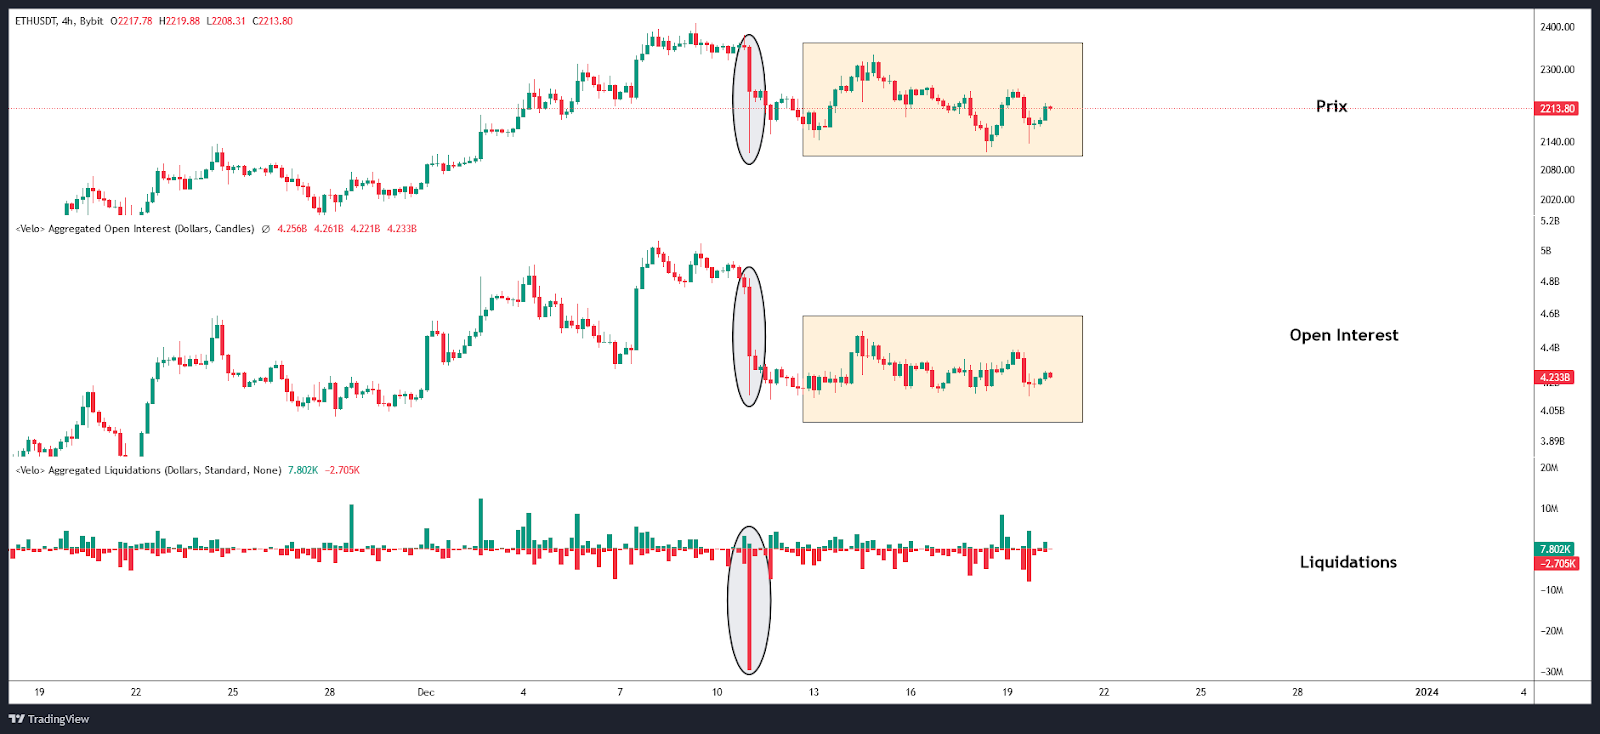
After failing to cross $2,400, Ethereum’s open interest fell by around 19%. This represents almost $960 million less positions on ETH contracts. This decline was accompanied by significant liquidations on the buyer side. Thus, all of these elements demonstrate a reduction in the engagement of traders in the market, thus suggesting an opportunity to reevaluate one’s strategy. Since then, ETH’s open interest has stagnated, suggesting traders still lack conviction in the token’s future performance.
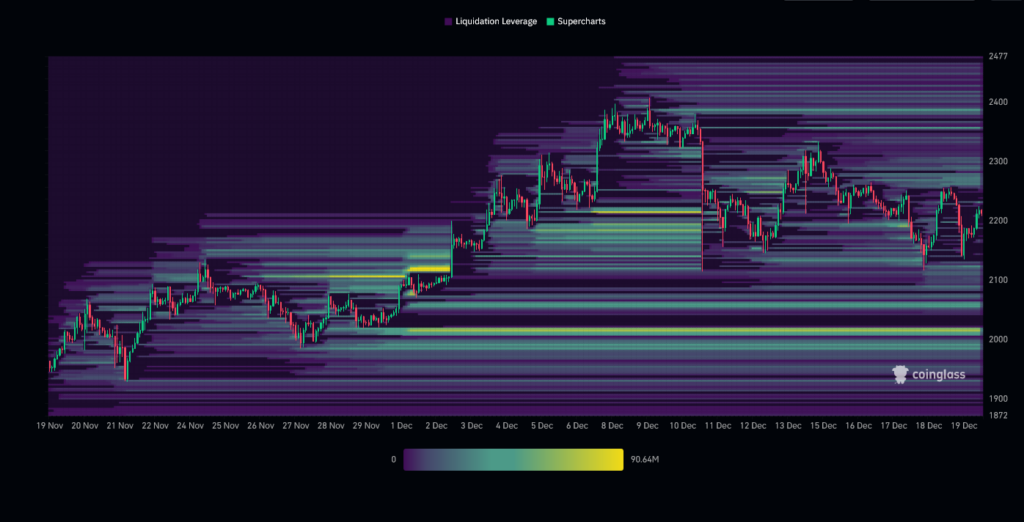
The Ethereum liquidation heatmap reveals that, as of today, the most significant liquidation zone is slightly above $2,000. Indeed, we observe that this level has attracted notable interest from traders since the end of November. As the market approaches these levels, it could trigger a large number of orders, which, naturally, could increase the volatility of the cryptocurrency. Therefore, this area must be attractive for investors.
Hypotheses for the price of Ethereum (ETH)
If the price of Ethereum remains above $2,140, we could anticipate a bullish continuation up to the $2,300 level. The next resistance to take into account, if the upward movement continues, would be the threshold of $2,400 or $2,500. At this stage, this would represent an increase close to +16%.
If the price of Ethereum does not remain above $2,140, we could envisage a return to $2,000 or even $1,900. The next support to consider, if the bearish movement continues, would be more or less at the $1,800 levels. At this stage, this would represent a drop close to -15%.
Conclusion
After failing at $2,400, Ethereum tends to recover its decline. Therefore, increased support from buyers is necessary to reinforce the hypothesis of a bullish continuation. Otherwise, a continuation of the bearish movement could continue. Therefore, it is imperative to carefully monitor the price reaction at different key levels to confirm or refute the current assumptions. Beware of potential “fake out” and “market squeeze” in each situation. Additionally, let’s not forget that these scenarios are based solely on technical analysis. The price of cryptocurrencies may change more or less quickly, depending on other more fundamental factors.
Maximize your Tremplin.io experience with our ‘Read to Earn’ program! For every article you read, earn points and access exclusive rewards. Sign up now and start earning benefits.