A paper published in November 2022 by two researchers from the Moscow School of Economics deserves the attention of cryptocurrency traders. Among the 7 trading strategies considered, one of them seems to show good results. For researchers, “this empirical evidence makes this trading strategy one of the most interesting considered so far”. Indeed, it must be said that trading cryptocurrencies often remains a complex and expensive affair for some. Will optimization by models be a solution?
Quantitative Theory of Money and bitcoin (BTC)
Among the 7 models considered, the model that seems to best describe the price of bitcoin is based on Modern Quantitative Theory. Publications had already shown the interesting link between the price of bitcoin and its behavior considered in the “monetary” sense (The challenges of the bitcoin mining supply – Tremplin.io).
Produced wealth and fundamental value
A model developed by Chris Burniske in 2017 caught the attention of researchers. The search for a theoretical model capable of describing the price of bitcoin is strategic for the future of cryptocurrencies. Indeed, the latter are sometimes perceived as a bubble, devoid of quantifiable and rational value.
Among economists, the study of money is often based on the quantity theory of money. That is to say that the quantity of money in circulation multiplied by its speed of circulation is equivalent to all the wealth produced. Likewise, this amounts to affirming that the price of each good/service multiplied by its quantity gives the total wealth produced.
“The INET model was developed by [55] to evaluate the fictional INET token program. Its starting point is the quantity theory of money, which maintains that the price level of goods and services is proportional to the quantity of money in circulation, and it is based on the following equation:
M0 x V = P x Q = Y
where M0 represents the monetary base, V is the monetary velocity, P is the price of the digital resource that is provided, Q is the quantity of that digital resource, while Y is the gross domestic product (GDP) of the crypto economy based on this digital asset. »
information-13-00560-v2.pdf
In the case of cryptocurrencies, this model requires some adjustments. So theauthor Burniske specifies that “M is the size of the monetary base necessary to support a cryptoeconomy of size PQ, at speed V”. In this way, we seek to measure the wealth produced by the cryptocurrency ecosystem. Consequently, this wealth produced would be comparable to the value of the transactions carried out. In addition, this could explain the existence of a “separate” monetary mass, which would justify higher rates in the crypto ecosystem (staking, etc.).
The “INET” model
The creator of the model recalls that “I don’t use these models as price targets in the same way that stock analysts create price targets for the stocks they cover”. Therefore, the initial objective of this model remains to quantify a market value. But to adapt the model, the researchers calculate wealth Y as the product between the number of cryptocurrencies exchanged for consumption (or speculation here) and their price.
Likewise, velocity is considered as the ratio between the volume of transactions (PQ) and the quantity of tokens in circulation (M). So we have the money supply of the token multiplied by its velocity equal to the price of the token multiplied by the tokens transferred for consumption. From then on, we deduce the value of the ratio that interests us.
Indeed, by reducing this to values of proportion (by dividing by the total supply), we have the ratio of the INET model expressed as the ratio between the number of tokens transferred for consumption (or speculation if applicable) and the volume of transactions. Which is equivalent for researchers, in economic terms, to the money supply divided by the wealth exchanged (see more).
Interpret the ratio
Once the ratio is defined, it must be adapted and interpreted. A high ratio will reflect the fact that speculative trading is high, but overall trading volume remains low. Interest may not be sustained… By analogy, it is as if the money supply increased significantly but the wealth exchanged decreased. Which implies a drop in the speed of circulation of money. The weakness of trade is greater, and the instability of the wealth produced increases.
“If this indicator is high, the proportion of speculative transactions has increased, while if it is low, the proportion of speculative transactions has decreased. The name of the ratio, InetSpe, was chosen to show that this ratio is a variation of the INET model used here for short-term speculative trading purposes. This ratio is often used for trading purposes. We note that in Chris Burniske’s original model for annual data, there is an additional part used to calculate the current value of a currency. »
information-13-00560-v2.pdf
Regarding strategy, researchers have “used the 5% quantile as a signal to enter a long position and the 95% quantile as a signal to sell and close our position”.
Results
The results obtained are varied, but positive for this model. The relationship between risk and return is therefore the most interesting for the INET model. The maximum loss is also the lowest. In addition, the maximum gain is quite significant.
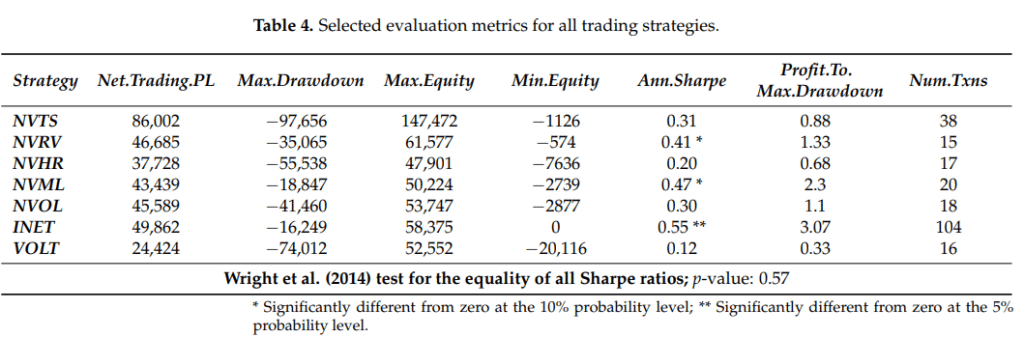
Of course, carrying out past tests does not predict the future. However, this model sometimes seems even more effective by widening the quantiles in the strategy. Between 2011 and 2017, this model significantly outperformed most others.
“A variation of Chris Burniske’s INET model modified for short-term trading had the lowest maximum drawdown and highest annualized Sharpe ratio for the entire sample. However, its performance deteriorated significantly after 2017.”
information-13-00560-v2.pdf
Despite everything, this model has a disadvantage due to the large number of transactions it generates. Indeed, “its main limitation is probably the large number of transactions involved, which can result in a large number of transaction fees to pay and much lower trading profits”.
Metcalfe’s Law
In our previous post, we had the opportunity to discuss the role of transaction volume, network activity, hash rate, etc… It thus appears that “the value of a network is proportional to the square of the number of its nodes or end users”. The researchers’ model therefore also proposes a long-term approach, which would provide guidance to investors.
“Our empirical analysis offers two conclusions. First of all, it once again confirmed the importance of Metcalfe’s Law for valuing crypto assets, according to which the value of a network is proportional to the square of the number of users. Metcalfe’s Law is generally used for long-term valuation and to identify possible price bubbles when the market price deviates too far from the underlying fundamental level. However, our back-testing results showed that such an approach can also be useful for short-term trading in different market conditions. »
information-13-00560-v2.pdf
From data provided by Glassnode, the number of active addresses smoothed by a moving average represents the trajectory of the bitcoin price quite well. However, the same applies to activity indicators (number of transactions, hash rate, etc.).
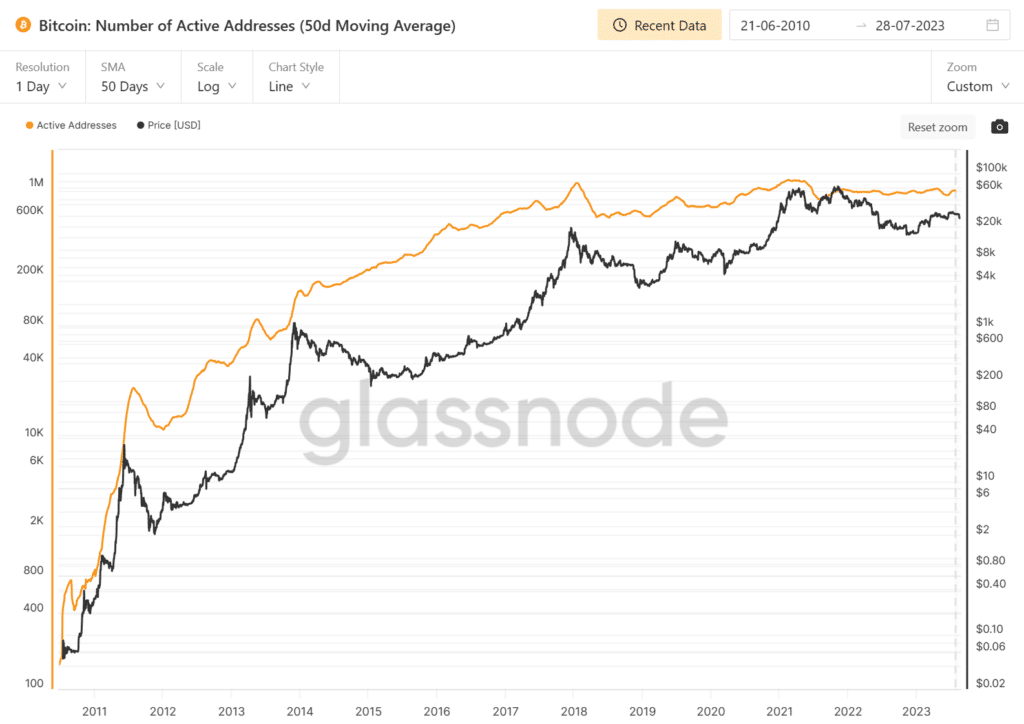
The INET model appears to be a reciprocal of Metcalfe’s law. When the number of new users declines, demand falls, the price of bitcoin falls and the speed of circulation gradually increases, because there would be proportionately more active players.
In conclusion
Ultimately, we saw that the price of bitcoin could show a certain academic interest. The novelty of the debate and the ecosystem attract the attention of researchers. It appears once again that the price of bitcoin is strongly linked to numerous activity indicators. Therefore, the democratization of Bitcoin is the main justification for its long-term progress. However, bitcoin can also respond to monetary logic.
In any case, this is the bet of some. By considering the share of speculative transactions compared to the total volume, a certain relevance seems to emerge. We have already had the opportunity to recall that an increase in velocity often explains the phases of decline in the price of bitcoin. In the long term, we see the fall in the velocity of the bitcoin price (the rise in price). A too strong increase in the price of bitcoin will reduce the speed of circulation of bitcoin, and finally, a drop in interest (democratization) will lead to a fall in the price, and so on… This model seems to present relevant results, on the basis of an oscillator model, but the less volatile behavior of the bitcoin price calls for caution.
Receive a summary of the news in the world of cryptocurrencies by subscribing to our new service daily and weekly so you don’t miss anything of the Tremplin.io essentials!