
A subject catches our attention. That of temporal effects… A temporal effect designates the regular repetition of a behavior on the price of an asset at a given time. For example, we empirically observe that Wednesday is the most bullish day on bitcoin since 2018 (BTC). The study of temporal effects is all the more important as they can be amplified by volatility. But the best performing days can change from year to year, which adds to the difficulty. Discover our special study.
Is Wednesday the most profitable day?
We conducted an extensive statistical study. The latter covers daily bitcoin data between July 2018 and July 2023. Thus, this study represents the evolution of the bitcoin price over more than 260 weeks. This allows us to consider this sample as sufficiently representative.
“The adjusted seasonality (of volatility) on the price of bitcoin shows that the most profitable months are October, February, July, and December, as well as September (down). […] 62% of the time, the price of bitcoin goes up between (end) September and December. The average increase in the latter is more than 70% over the period in question. We therefore have a favorable seasonality in the fall for bitcoin.”
The seasonality of bitcoin (BTC) – Tremplin.io
We studied in our previous article the seasonality of bitcoin. The seasonality of bitcoin shows that a year-end bullish is coming off. Similarly, this is to be related to the stock markets. Thus the average performance of the CAC 40 is doubled between November and April compared to all the other months of the year.
Average variation according to the days of the week
The individual study of each week on the price of bitcoin since 2018 shows interesting conclusions. Indeed, the average performance seems to be affected depending on the day of the week. As a result, the average Wednesday performance since 2018 is +0.38%. Conversely, the average performance on Thursdays is -0.27%. The objective of such an analysis is to “filter” the periods where the probabilities of loss are higher.
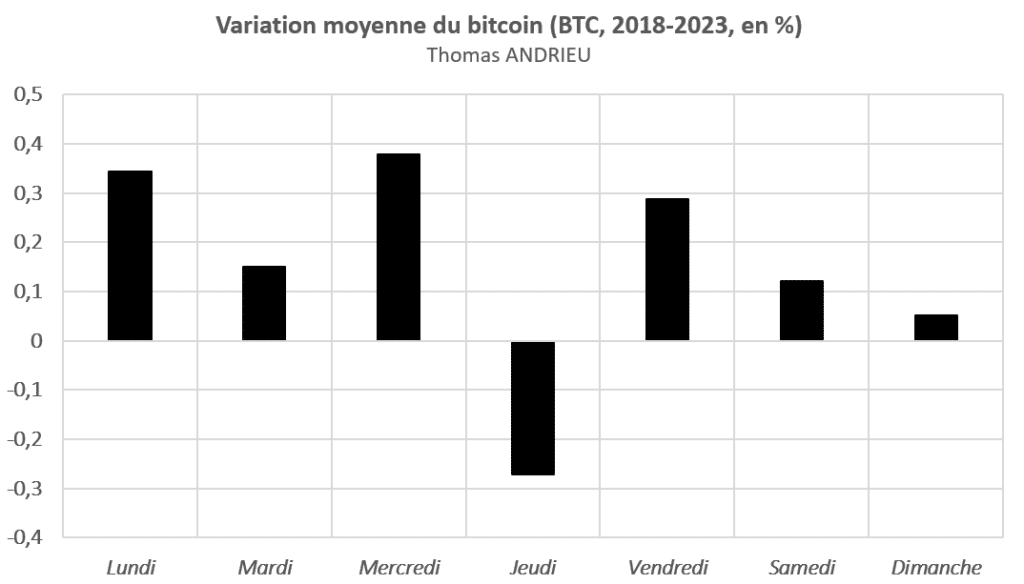
This graph shows a significant conclusion and reveals the existence of regularities. Several observations follow from our analysis.
- On the one hand, the Weekend shows a great weakness in performance. This seems fundamentally justified. Indeed, bitcoin is highly correlated to stock market indices which are closed on weekends. Therefore, bitcoin’s weekend stagnation is a response to inactivity in traditional markets.
- On the other hand, Monday and Wednesday seem to be the best performing months. The average performance of Mondays and Wednesdays is significant enough and exceeds +0.3%. Indeed, the average daily performance of bitcoin (all days combined) is +0.15%. Without Monday and Wednesday, the average performance of bitcoin since 2018 would have been only +0.06%!
What theoretical performance?
Ultimately, Monday and Wednesday alone explain more than 55% of bitcoin’s total performance, while they account for less than 30% of the time. This temporal effect therefore limits risk exposure and maximizes performance.
Therefore, the theory is that someone who buys for 24 hours every Monday and Wednesday would have an average weekly performance of +0.72%. Or +45.18% per year on average. Of course, this would be based on the profile of the investor who would have carried out this strategy over the last 5 years.
In theory, this strategy makes it possible to outperform the market over the long term. Indeed, the average annual performance of bitcoin is +37% between 2018 and 2023. On the other hand, this strategy leaves open the possibility of gaining nearly 8 performance points per year. But as we will show, this strategy is subject to variability, which limits its relevance a posteriori.
Which days are the most reliable?
The study of the daily average is not enough. Indeed, it is possible that the variations actually observed deviate completely from the average, with extremely high or weak variations. To correct for this effect, we measured the volatility (instability) of the variations depending on the day of the week. We then adjusted the average daily performance by the volatility of the data. We obtain an “index” which shows us the days with an ideal performance/reliability trade-off.
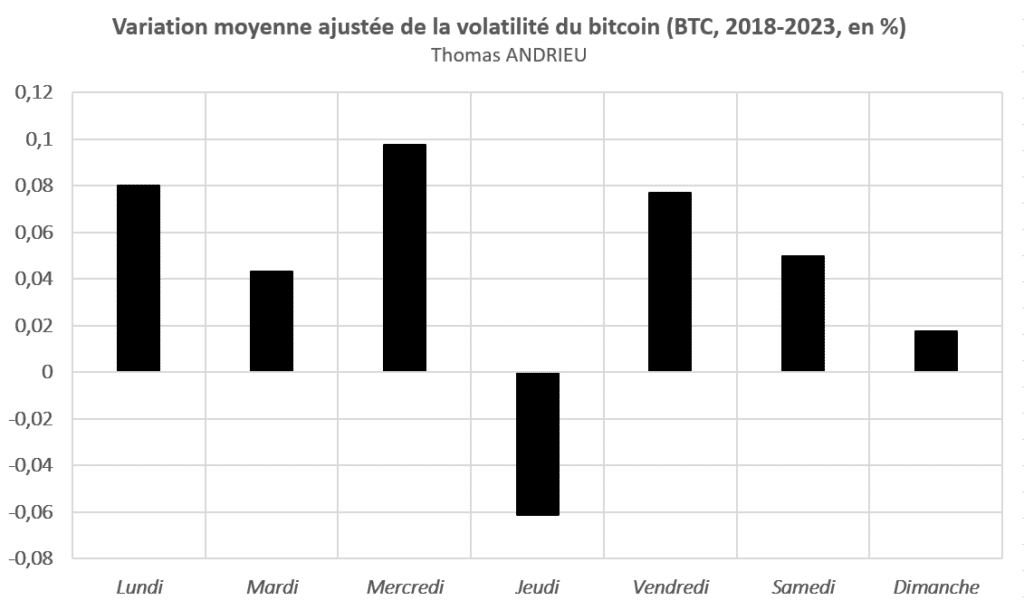
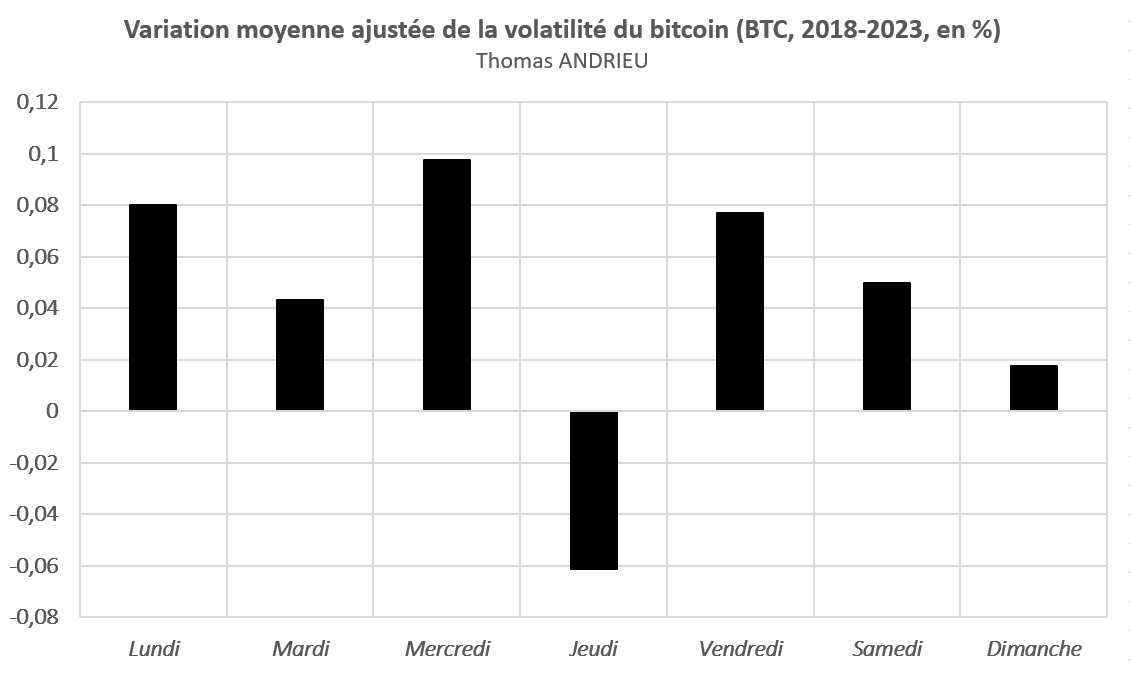
It is observed that the day which presents the best reliability and the best performance is Wednesday. Then, we will note Monday and Friday. Conversely, Thursday seems a fairly reliable day and performs well on the downside. Thursday is however the day with the most volatility, i.e. truly bearish Thursdays explain much of the behavior. Conversely, Saturday is the least volatile day of the week, but its bullish performance is not very marked.
A rule still valid in 2023?
If a long period makes it possible to show the validity of our analysis, it remains to verify this in recent times. Indeed, this general observation may not fit exactly in certain years. In this case, it is better to study the average performance over a shorter period (the past year). Thus, over the last 52 weeks, slightly different conclusions appear.
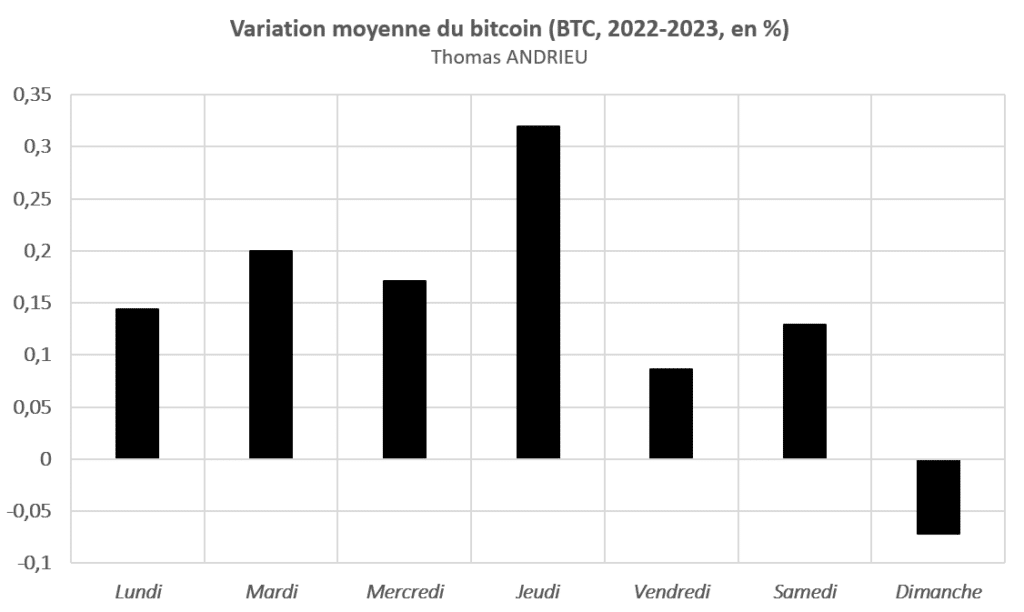
Between July 2022 and July 2023, Thursday is the best performing day of the week. Thursday’s performance stands at +0.32% on average. This observation confirms that Thursday is an unstable day and can change radically from one year to the next. Wednesday’s strong performance seems to have shifted to Thursday in the recent period.
Nevertheless, we find that Tuesday, Wednesday and Monday have been the best performing days of the week since 2022 (excluding Thursday). An investor who positioned himself every Monday and every Wednesday over the past year would have had an annual performance of +17.7%. This performance would have been +30% including Wednesday. This is not negligible, but it remains lower than the overall performance of bitcoin over the same period (+50%).
It seems clear to us that this strategy is all the more efficient when the performances between the days are different. Fairly comparable performances between days (as in 2022) are not a source of performance maximization for the investor. The probability of outperforming the market becomes lower.
The last two years have been very marked
Between July 2021 and July 2023, the price of bitcoin fell by 15%. Yet over the same period, the days performed very differently. Tuesday and Wednesday always stand out as bullish days. But Monday, Thursday and Friday were very bearish between 2021 and 2023. However, it is surprising to see that Sunday was very bullish in 2021. This analysis once again shows the extreme variability of this strategy. Even so, Tuesday and Wednesday seem to stand out for their reliability.
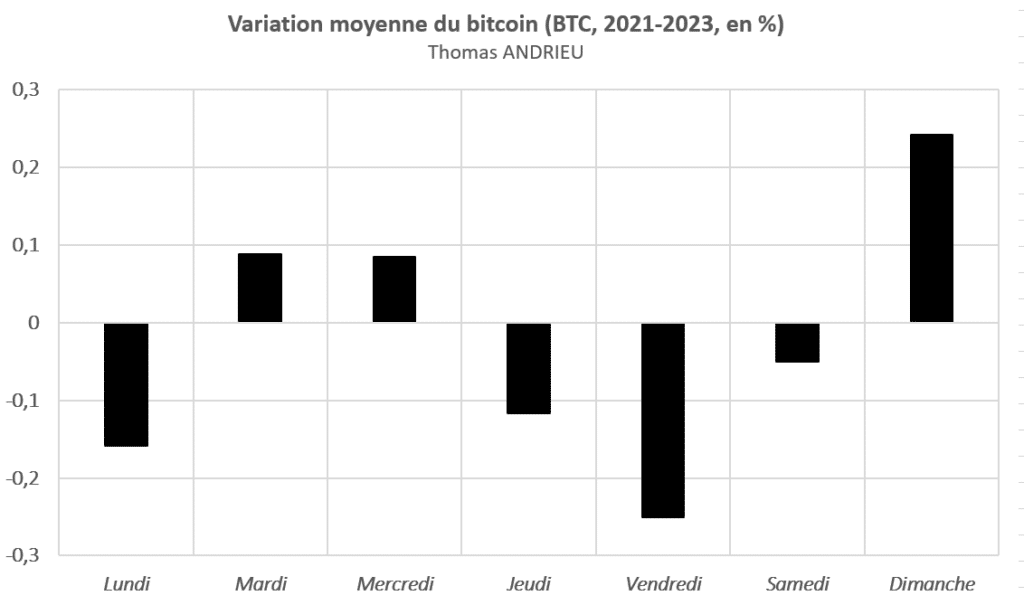
Moreover, Monday was very bearish in 2021. A Monday/Wednesday strategy would have delivered an annual loss of 3.6% between 2021 and 2023, which is still more than acceptable. In addition, we recall that bitcoin fell by 15% over the same period. There is therefore, in this case, a relative outperformance.
In conclusion
Ultimately, there is indeed an asymmetry in performance depending on the day of the week for bitcoin. There does seem to be a “beginning of the week effect” which concentrates most of bitcoin’s performance. Data studied between 2018 and 2023 shows that Monday and Wednesday would be the best performing days on average. Conversely, the Weekend would experience a weak performance. More generally, the combination of Monday, Tuesday and Wednesday clearly shows an outperformance over the rest of the week.
However, this rule has exceptions and changes. It is not uncommon for the best performing days to be very different from year to year. Thus Thursday, which was the most negative day since 2018, was the best performing day between 2022 and 2023. Likewise, Sunday showed a strong performance in 2021. Therefore, this rule is highly variable and incentivizes to caution. But we still observe that this strategy can provide, for a minimum of risk (exposure), many periods of outperformance.
Receive a digest of news in the world of cryptocurrencies by subscribing to our new service of daily and weekly so you don’t miss any of the essential Tremplin.io!


